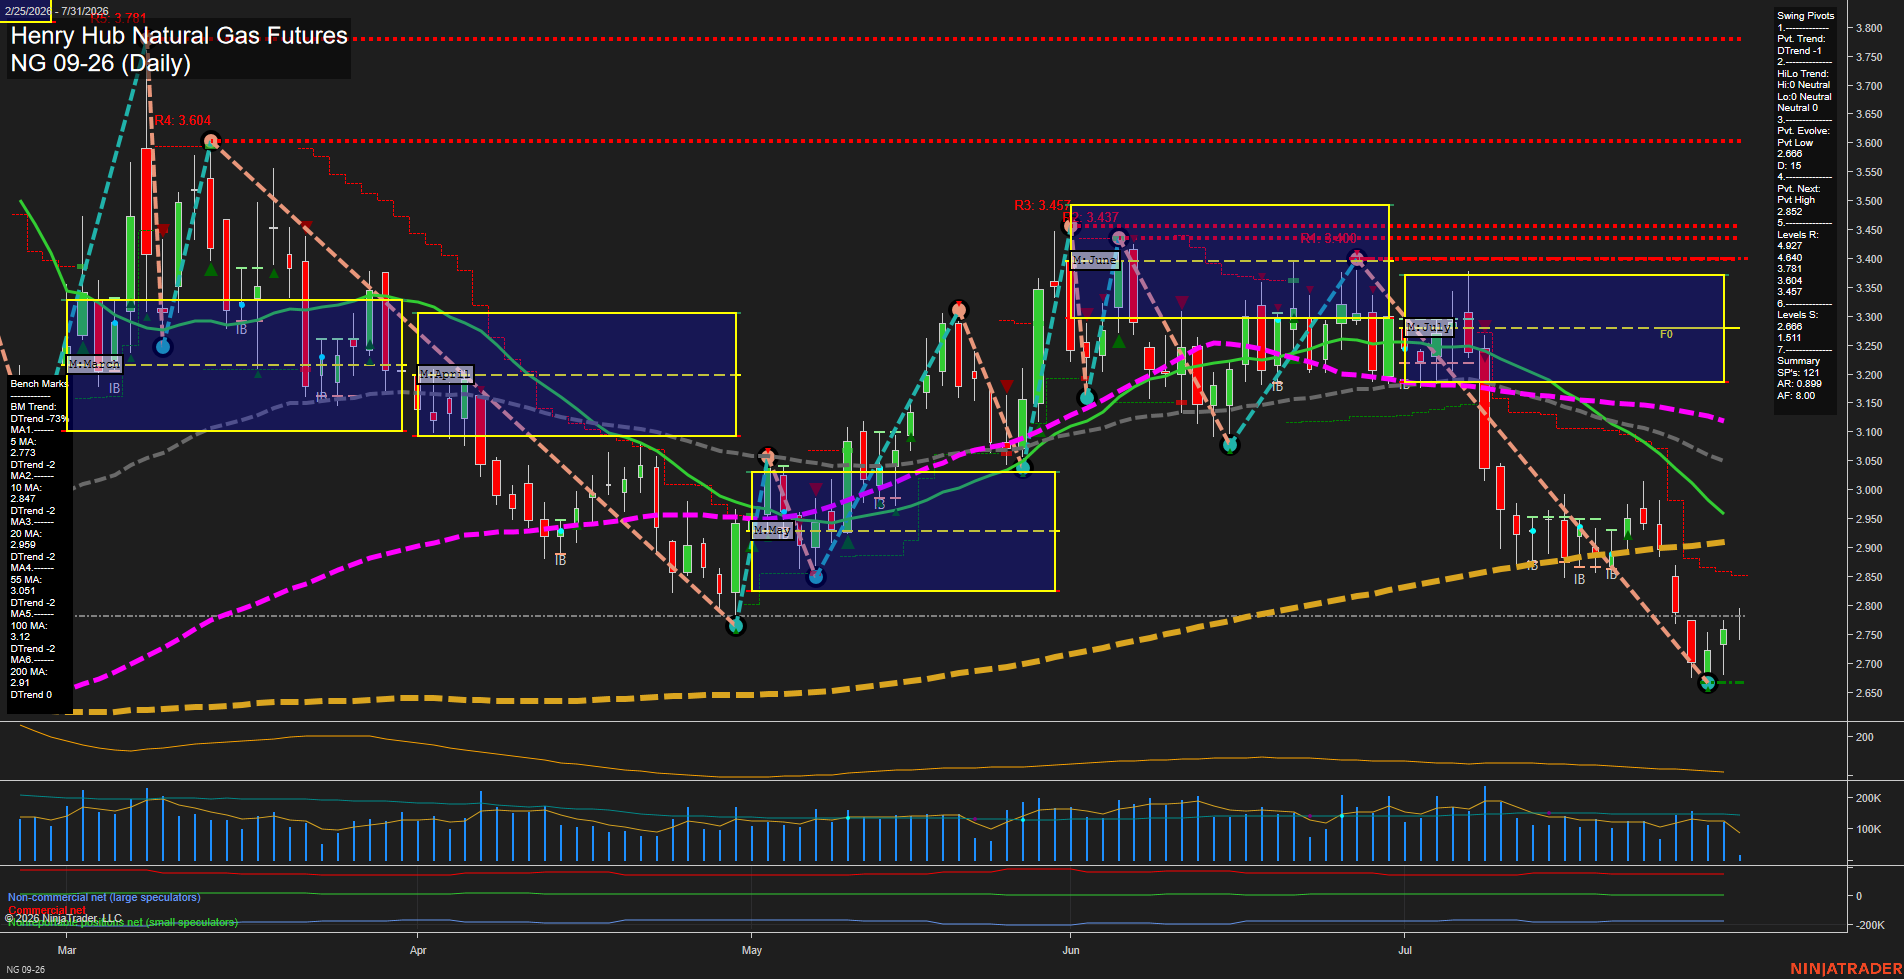
NG Henry Hub Natural Gas Futures Daily Chart Analysis: 2026-Jul-31 07:05 CT
Price Action
- Last: 2.781,
- Bars: Medium,
- Mom: Fast.
WSFG Weekly
- Short-Term
- WSFG Current: -24%
- F0%/NTZ' Bias: Price Below,
- WSFG Trend: Down.
MSFG Month Jul
- Intermediate-Term
- MSFG Current: -104%
- F0%/NTZ' Bias: Price Below,
- MSFG Trend: Down.
YSFG Year 2026
- Long-Term
- YSFG Current: 13%
- F0%/NTZ' Bias: Price Above,
- YSFG Trend: Up.
Swing Pivots
- (Short-Term) 1. Pvt. Trend: DTrend,
- (Intermediate-Term) 2. HiLo Trend: Neutral,
- 3. Pvt. Evolve: Pvt low 2.686,
- 4. Pvt. Next: Pvt high 2.892,
- 5. Levels R: 4.990, 4.640, 3.781, 3.604, 3.457,
- 6. Levels S: 2.686, 1.511.
Daily Benchmarks
- (Short-Term) 5 Day: 2.773 Down Trend,
- (Short-Term) 10 Day: 2.847 Down Trend,
- (Intermediate-Term) 20 Day: 2.956 Down Trend,
- (Intermediate-Term) 55 Day: 3.051 Down Trend,
- (Long-Term) 100 Day: 3.120 Down Trend,
- (Long-Term) 200 Day: 2.910 Down Trend.
Additional Metrics
Overall Rating
- Short-Term: Bearish,
- Intermediate-Term: Bearish,
- Long-Term: Neutral.
Key Insights Summary
NG remains in a fast short-term decline, with price below the weekly and monthly F0% levels and beneath every daily benchmark. The 2.686 pivot low has produced a modest rebound, but the pivot structure remains DTrend and 2.892 is the nearest reversal threshold for a new pivot high. The broader 2026 grid remains positive, creating a longer-term countertrend backdrop beneath the current July selloff. Recent volume has softened while ATR remains elevated, consistent with a volatile decline transitioning into a potential short-term stabilization phase near the 2.686 support.
Chart Analysis ATS AI Generated: 2026-07-31 07:06 for Informational use only, not trading advice. Terms and Risk Disclosure Copyright © 2026. Algo Trading Systems LLC.