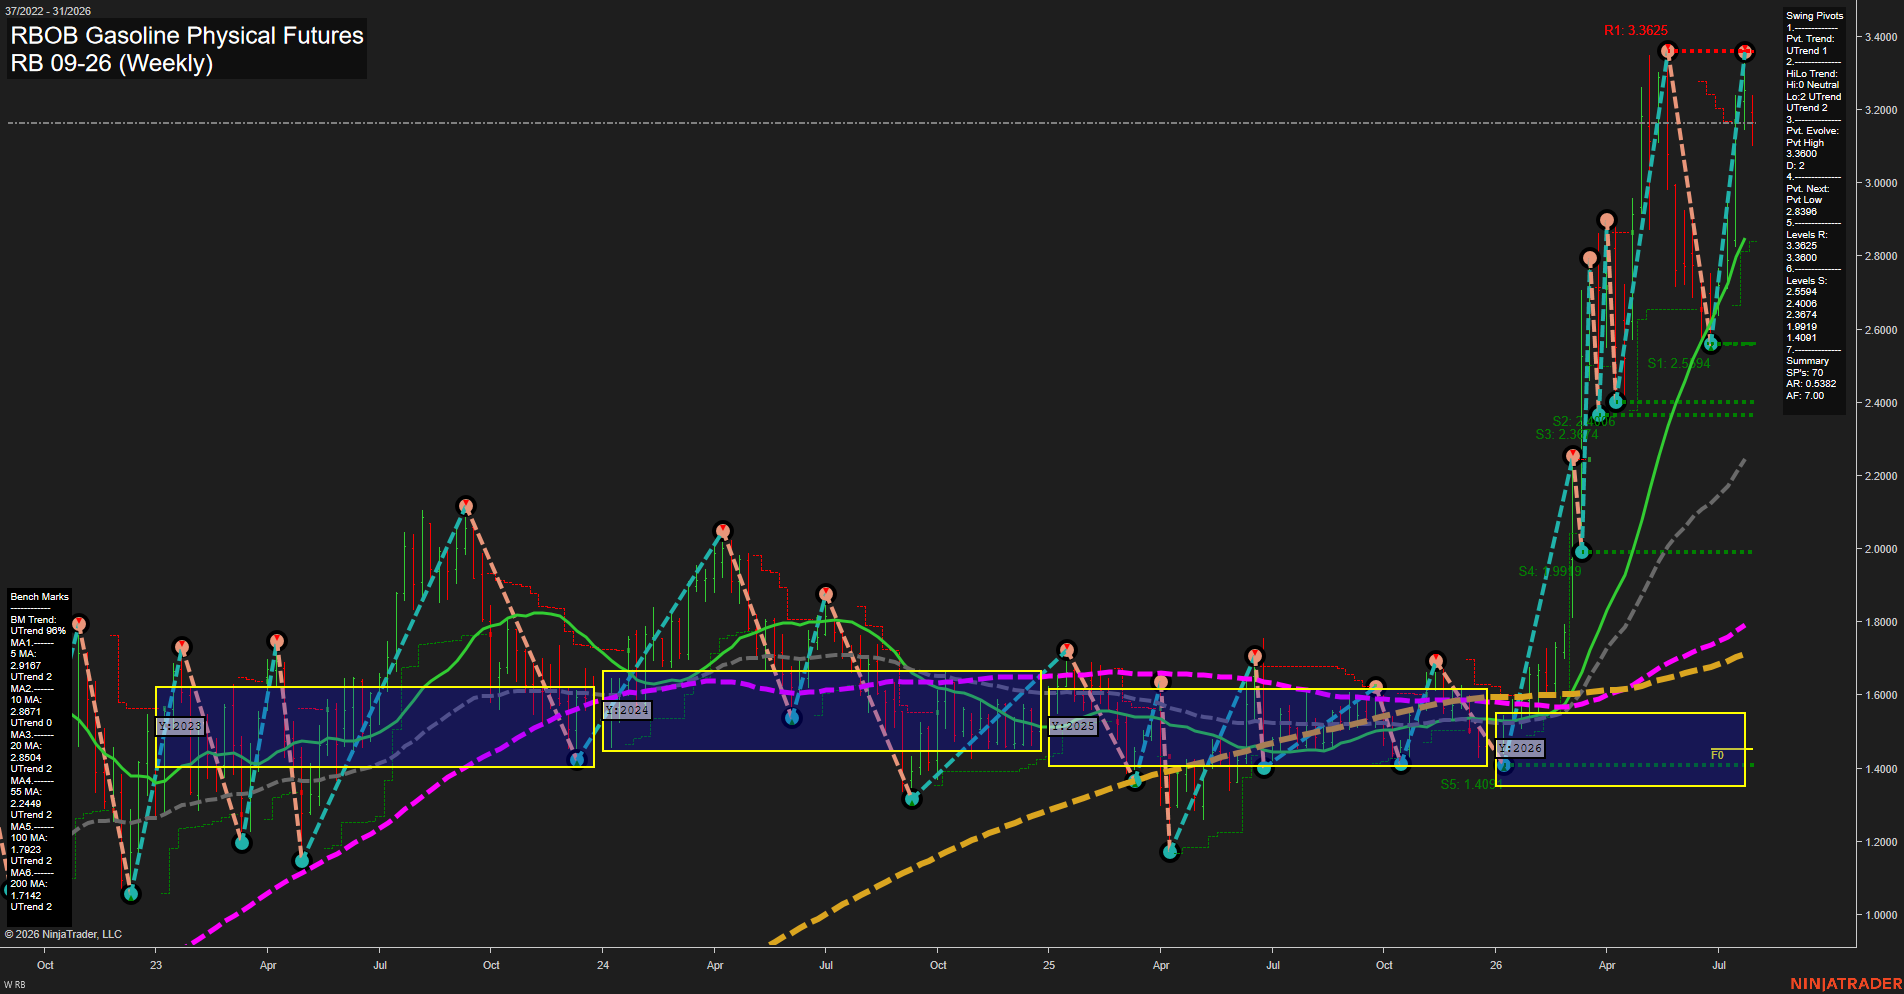
RB RBOB Gasoline Physical Futures Weekly Chart Analysis: 2026-Jul-30 07:08 CT
Price Action
- Last: 3.3625,
- Bars: Large,
- Mom: fast.
WSFG Weekly
- Short-Term
- WSFG Current: -9%
- F0%/NTZ' Bias: Price Below,
- WSFG Trend: Down.
MSFG Month Jul
- Intermediate-Term
- MSFG Current: 72%
- F0%/NTZ' Bias: Price Above,
- MSFG Trend: Up.
YSFG Year 2026
- Long-Term
- YSFG Current: 172%
- F0%/NTZ' Bias: Price Above,
- YSFG Trend: Up.
Swing Pivots
- (Short-Term) 1. Pvt. Trend: UTrend,
- (Intermediate-Term) 2. HiLo Trend: UTrend,
- 3. Pvt. Evolve: Pvt high 3.3625,
- 4. Pvt. Next: Pvt low 2.8398,
- 5. Levels R: 3.3625, 3.3600,
- 6. Levels S: 2.5594, 2.4008, 2.3674, 1.9919, 1.4091.
Weekly Benchmarks
- (Short-Term) 5 Day: 2.9167 Up Trend,
- (Short-Term) 10 Day: 2.8671 Up Trend,
- (Intermediate-Term) 20 Day: 2.8560 Up Trend,
- (Intermediate-Term) 55 Day: 2.2449 Up Trend,
- (Long-Term) 100 Day: 1.7923 Up Trend,
- (Long-Term) 200 Day: 1.7142 Up Trend.
Recent Trade Signals
- 29 Jul 2026: Long RB 09-26 @ 3.2209 Signals.USAR-WSFG
- 24 Jul 2026: Short RB 09-26 @ 3.2353 Signals.USAR.TR120
Overall Rating
- Short-Term: Bullish,
- Intermediate-Term: Bullish,
- Long-Term: Bullish.
Key Insights Summary
RB has extended sharply from the early-2026 base and is testing the 3.3600-3.3625 pivot-resistance zone with large weekly ranges and fast upside momentum. The short-term pivot structure remains in an uptrend, although the weekly Fib-grid reading remains below its F0%/NTZ reference and reflects a countertrend short-term condition. Monthly and yearly Fib-grid structure are firmly positive, while price stands materially above every rising benchmark average. The market’s swing structure shows higher highs and higher lows, with 2.8398 defining the next notable pivot-reversal level and 2.5594 the first deeper support reference.
Chart Analysis ATS AI Generated: 2026-07-30 07:08 for Informational use only, not trading advice. Terms and Risk Disclosure Copyright © 2026. Algo Trading Systems LLC.