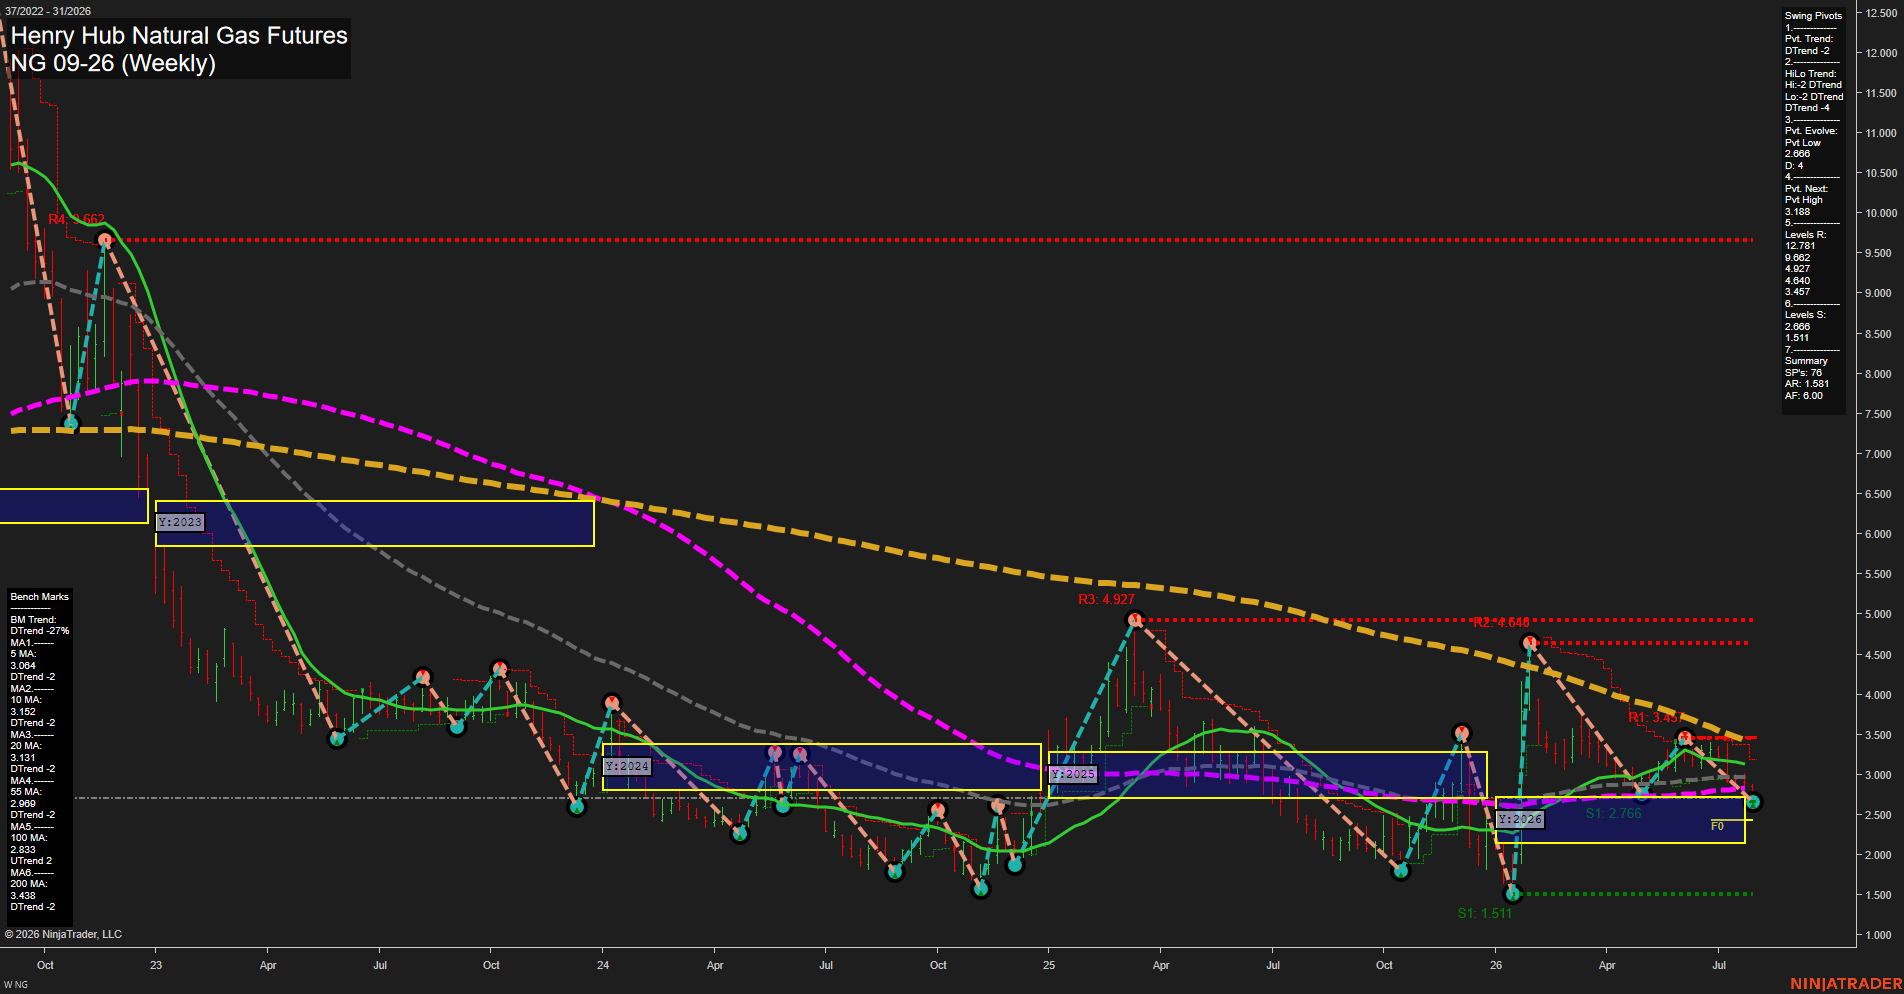
NG Henry Hub Natural Gas Futures Weekly Chart Analysis: 2026-Jul-30 07:06 CT
Price Action
- Last: 2.666,
- Bars: Medium,
- Mom: Momentum average.
WSFG Weekly
- Short-Term
- WSFG Current: -57%
- F0%/NTZ' Bias: Price Below,
- WSFG Trend: Down.
MSFG Month Jul
- Intermediate-Term
- MSFG Current: -121%
- F0%/NTZ' Bias: Price Below,
- MSFG Trend: Down.
YSFG Year 2026
- Long-Term
- YSFG Current: 10%
- F0%/NTZ' Bias: Price Above,
- YSFG Trend: Up.
Swing Pivots
- (Short-Term) 1. Pvt. Trend: DTrend,
- (Intermediate-Term) 2. HiLo Trend: DTrend,
- 3. Pvt. Evolve: Pvt low 2.666,
- 4. Pvt. Next: Pvt high 3.188,
- 5. Levels R: 12.781, 9.662, 4.927, 4.640, 3.457,
- 6. Levels S: 2.666, 1.511.
Weekly Benchmarks
- (Short-Term) 5 Day: 2.604 Down Trend,
- (Short-Term) 10 Day: 3.152 Down Trend,
- (Intermediate-Term) 20 Day: 3.131 Down Trend,
- (Intermediate-Term) 55 Day: 2.969 Down Trend,
- (Long-Term) 100 Day: 2.833 Down Trend,
- (Long-Term) 200 Day: 3.438 Down Trend.
Overall Rating
- Short-Term: Bearish,
- Intermediate-Term: Bearish,
- Long-Term: Bearish.
Key Insights Summary
Weekly natural gas remains in a broad bearish structure, with price below the weekly and monthly Fib-grid centers and beneath every benchmark average. The current 2.666 pivot low is the immediate structural support, while 3.188 is the reversal threshold required to establish the next swing high. The recent decline from the spring rally produced lower highs and a return toward the yearly support area; the YSFG remains marginally positive, but its longer-term upward bias is contradicted by declining 100- and 200-period benchmarks and the intermediate DTrend pivot structure.
Chart Analysis ATS AI Generated: 2026-07-30 07:06 for Informational use only, not trading advice. Terms and Risk Disclosure Copyright © 2026. Algo Trading Systems LLC.