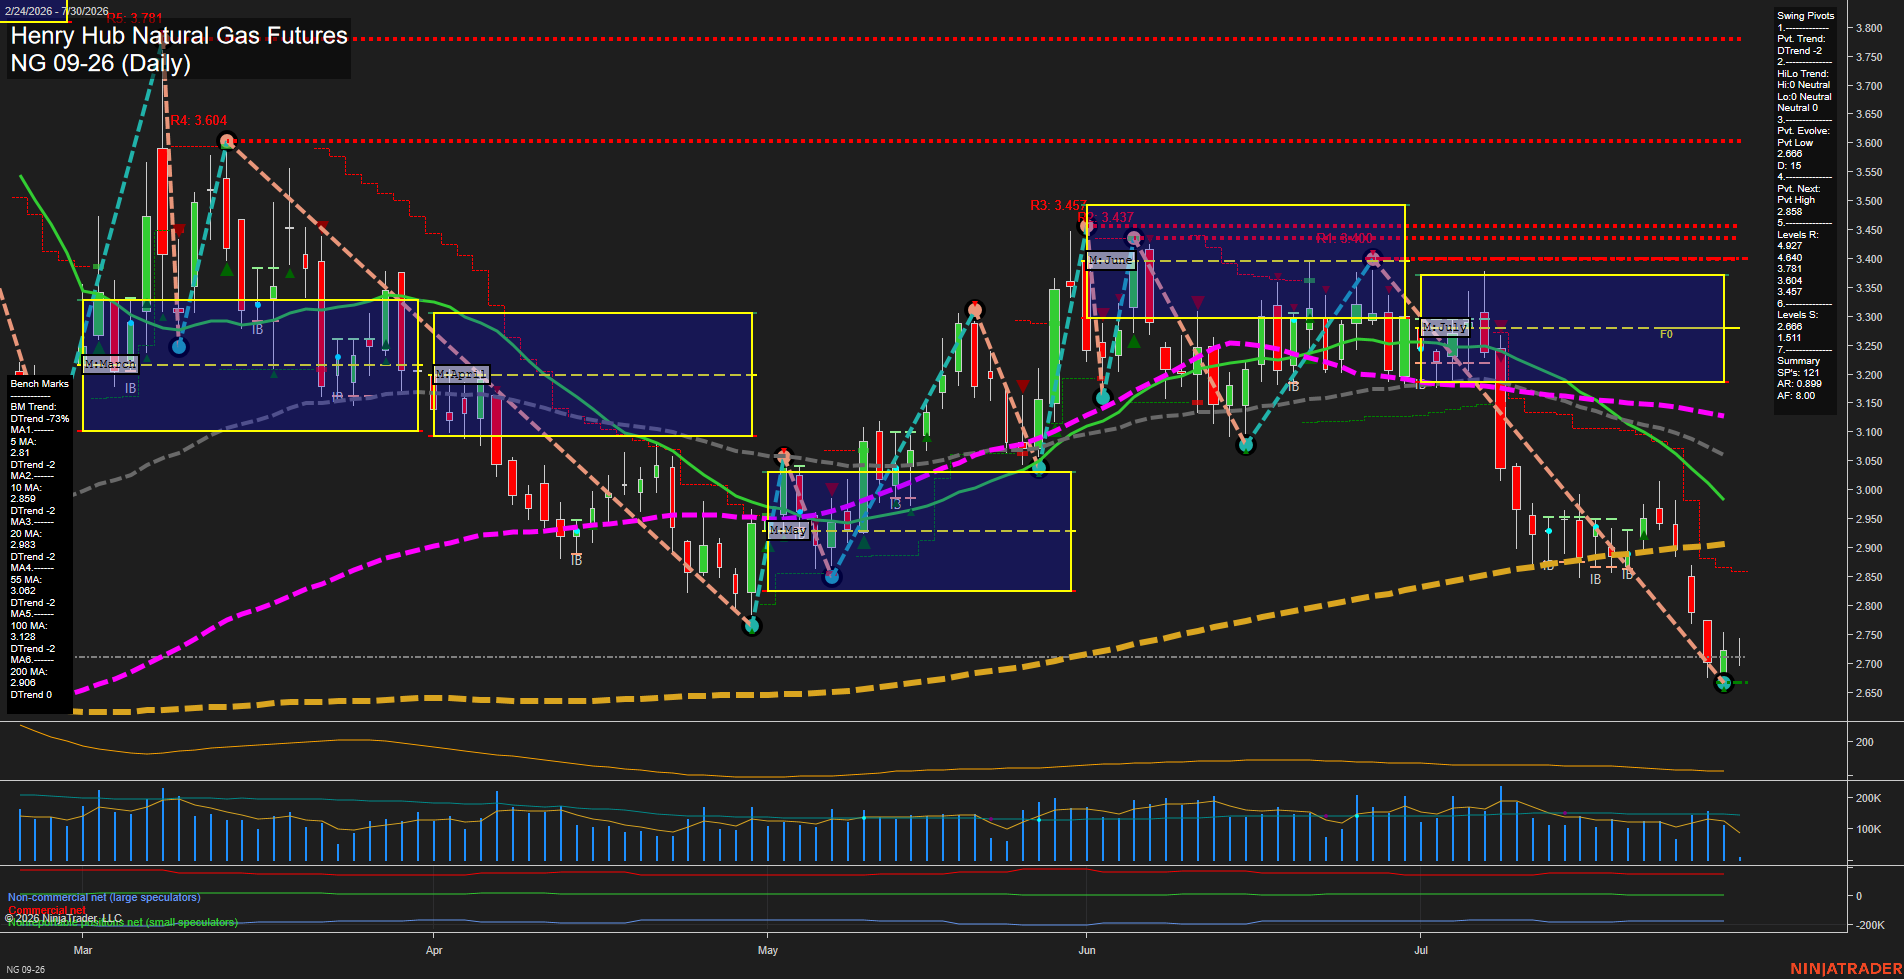
NG Henry Hub Natural Gas Futures Daily Chart Analysis: 2026-Jul-30 07:06 CT
Price Action
- Last: 2.724,
- Bars: Medium,
- Mom: fast.
WSFG Weekly
- Short-Term
- WSFG Current: -57%
- F0%/NTZ' Bias: Price Below,
- WSFG Trend: Down.
MSFG Month Jul
- Intermediate-Term
- MSFG Current: -121%
- F0%/NTZ' Bias: Price Below,
- MSFG Trend: Down.
YSFG Year 2026
- Long-Term
- YSFG Current: 10%
- F0%/NTZ' Bias: Price Above,
- YSFG Trend: Up.
Swing Pivots
- (Short-Term) 1. Pvt. Trend: DTrend,
- (Intermediate-Term) 2. HiLo Trend: Neutral,
- 3. Pvt. Evolve: Pvt low 2.686,
- 4. Pvt. Next: Pvt high 2.885,
- 5. Levels R: 4.997, 4.604, 3.781, 3.604, 3.457,
- 6. Levels S: 2.686, 1.511.
Daily Benchmarks
- (Short-Term) 5 Day: 2.810 Down Trend,
- (Short-Term) 10 Day: 2.859 Down Trend,
- (Intermediate-Term) 20 Day: 2.898 Down Trend,
- (Intermediate-Term) 55 Day: 3.062 Down Trend,
- (Long-Term) 100 Day: 3.142 Down Trend,
- (Long-Term) 200 Day: 2.906 Down Trend.
Additional Metrics
Overall Rating
- Short-Term: Bearish,
- Intermediate-Term: Bearish,
- Long-Term: Neutral.
Key Insights Summary
Price is beneath the weekly and July monthly F0%/NTZ structures and below every daily benchmark, confirming broad downside alignment. The decline has accelerated from the July rejection zone near 3.40, producing lower highs and lower lows into the 2.686 pivot low. The current small rebound bar reflects stabilization near that low rather than a confirmed reversal; 2.885 is the nearby pivot threshold, while 2.906 to 2.898 contains clustered 200-day and 20-day benchmark resistance. The yearly grid remains marginally positive, but long-term structure is mixed as price has fallen below the 200-day average.
Chart Analysis ATS AI Generated: 2026-07-30 07:06 for Informational use only, not trading advice. Terms and Risk Disclosure Copyright © 2026. Algo Trading Systems LLC.