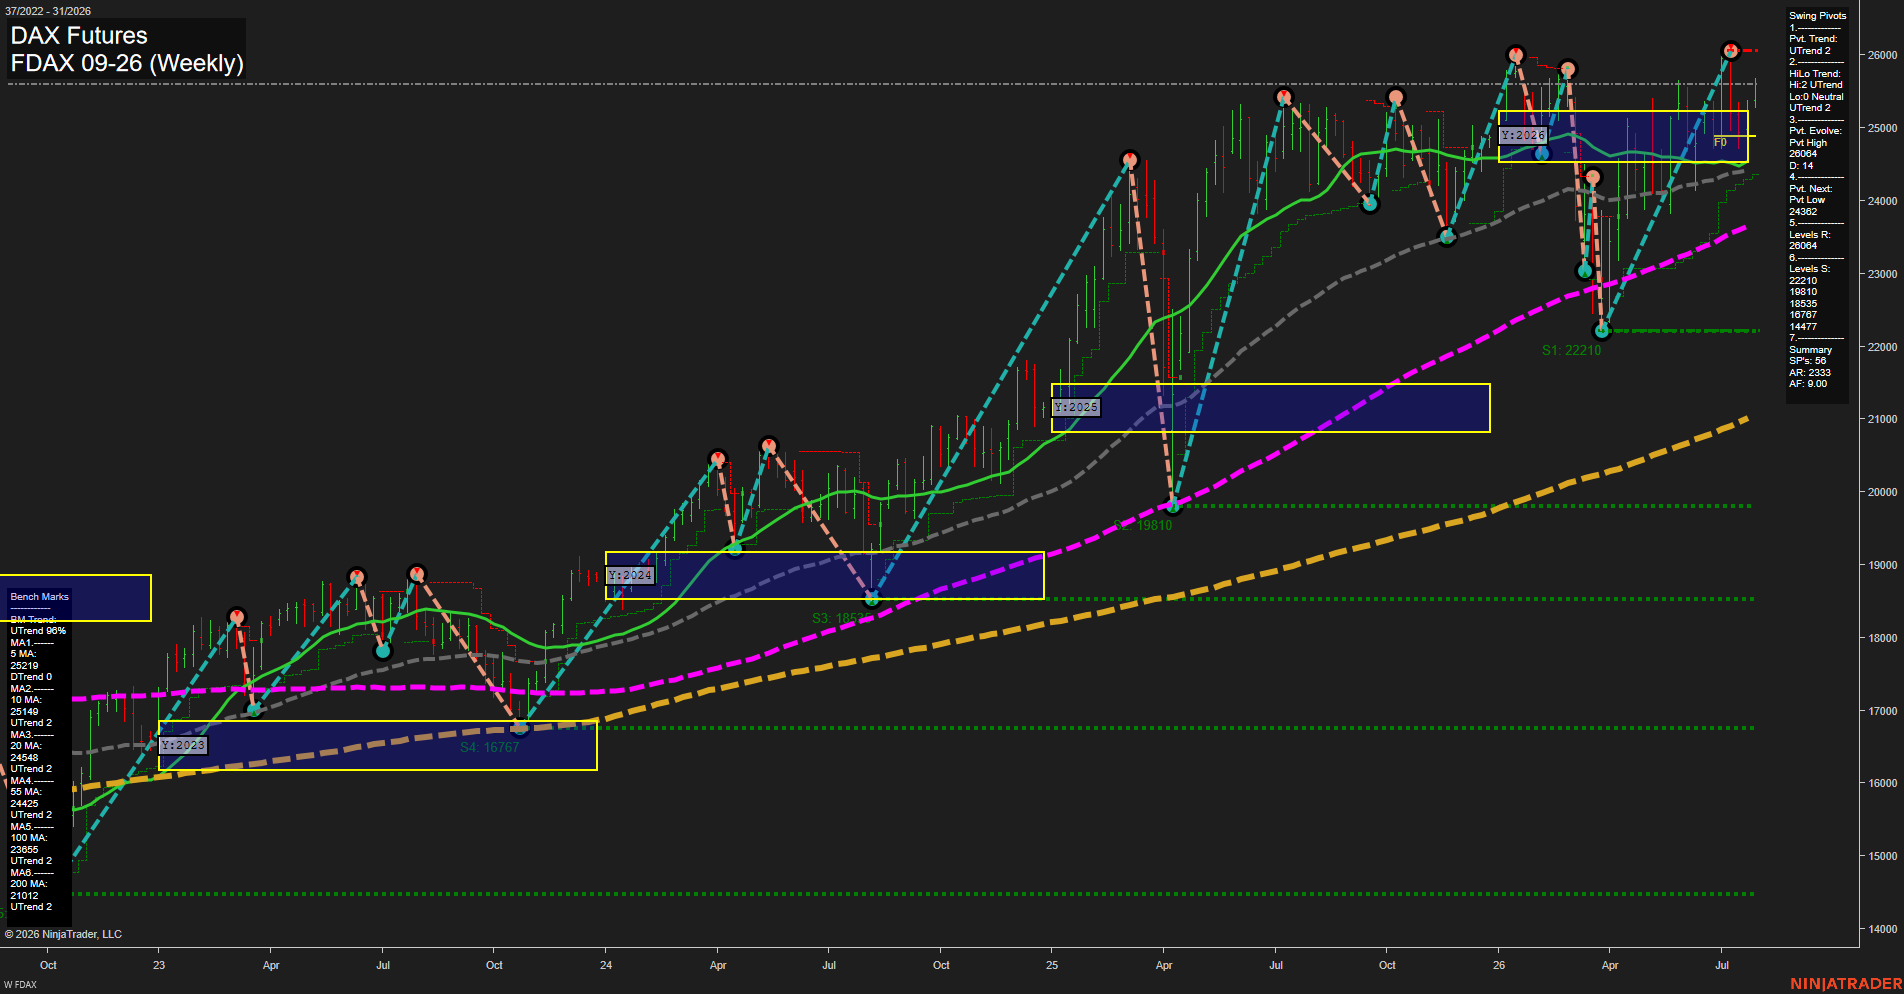
FDAX DAX Futures Weekly Chart Analysis: 2026-Jul-30 07:05 CT
Price Action
- Last: 25604,
- Bars: Medium,
- Mom: Fast.
WSFG Weekly
- Short-Term
- WSFG Current: 29%
- F0%/NTZ' Bias: Price Above,
- WSFG Trend: Up.
MSFG Month Jul
- Intermediate-Term
- MSFG Current: 27%
- F0%/NTZ' Bias: Price Above,
- MSFG Trend: Up.
YSFG Year 2026
- Long-Term
- YSFG Current: 21%
- F0%/NTZ' Bias: Price Above,
- YSFG Trend: Up.
Swing Pivots
- (Short-Term) 1. Pvt. Trend: UTrend,
- (Intermediate-Term) 2. HiLo Trend: UTrend,
- 3. Pvt. Evolve: Pvt high 26064,
- 4. Pvt. Next: Pvt low 24362,
- 5. Levels R: 26064,
- 6. Levels S: 22210, 19810, 18535, 16767, 14477.
Weekly Benchmarks
- (Short-Term) 5 Day: 25214 Up Trend,
- (Short-Term) 10 Day: 25149 Up Trend,
- (Intermediate-Term) 20 Day: 24543 Up Trend,
- (Intermediate-Term) 55 Day: 24243 Up Trend,
- (Long-Term) 100 Day: 23655 Up Trend,
- (Long-Term) 200 Day: 21012 Up Trend.
Recent Trade Signals
- 30 Jul 2026: Long FDAX 09-26 @ 25504 Signals.USAR-MSFG
- 28 Jul 2026: Long FDAX 09-26 @ 25548 Signals.USAR-WSFG
- 24 Jul 2026: Long FDAX 09-26 @ 25204 Signals.USAR.TR120
Overall Rating
- Short-Term: Bullish,
- Intermediate-Term: Bullish,
- Long-Term: Bullish.
Key Insights Summary
FDAX remains in a broad weekly uptrend, supported by aligned rising benchmarks and higher swing-low structure. Price has recovered strongly from the April pivot low near 22210 and is pressing beneath the 26064 swing-high resistance, producing a renewed test of the prior peak. The 24362 pivot-next level defines the nearby structural reversal threshold, while the rising 20 and 55 period benchmarks reinforce the intermediate trend foundation. Recent WSFG, MSFG, and TR120 long signals align with the prevailing multi-timeframe bullish structure.
Chart Analysis ATS AI Generated: 2026-07-30 07:05 for Informational use only, not trading advice. Terms and Risk Disclosure Copyright © 2026. Algo Trading Systems LLC.