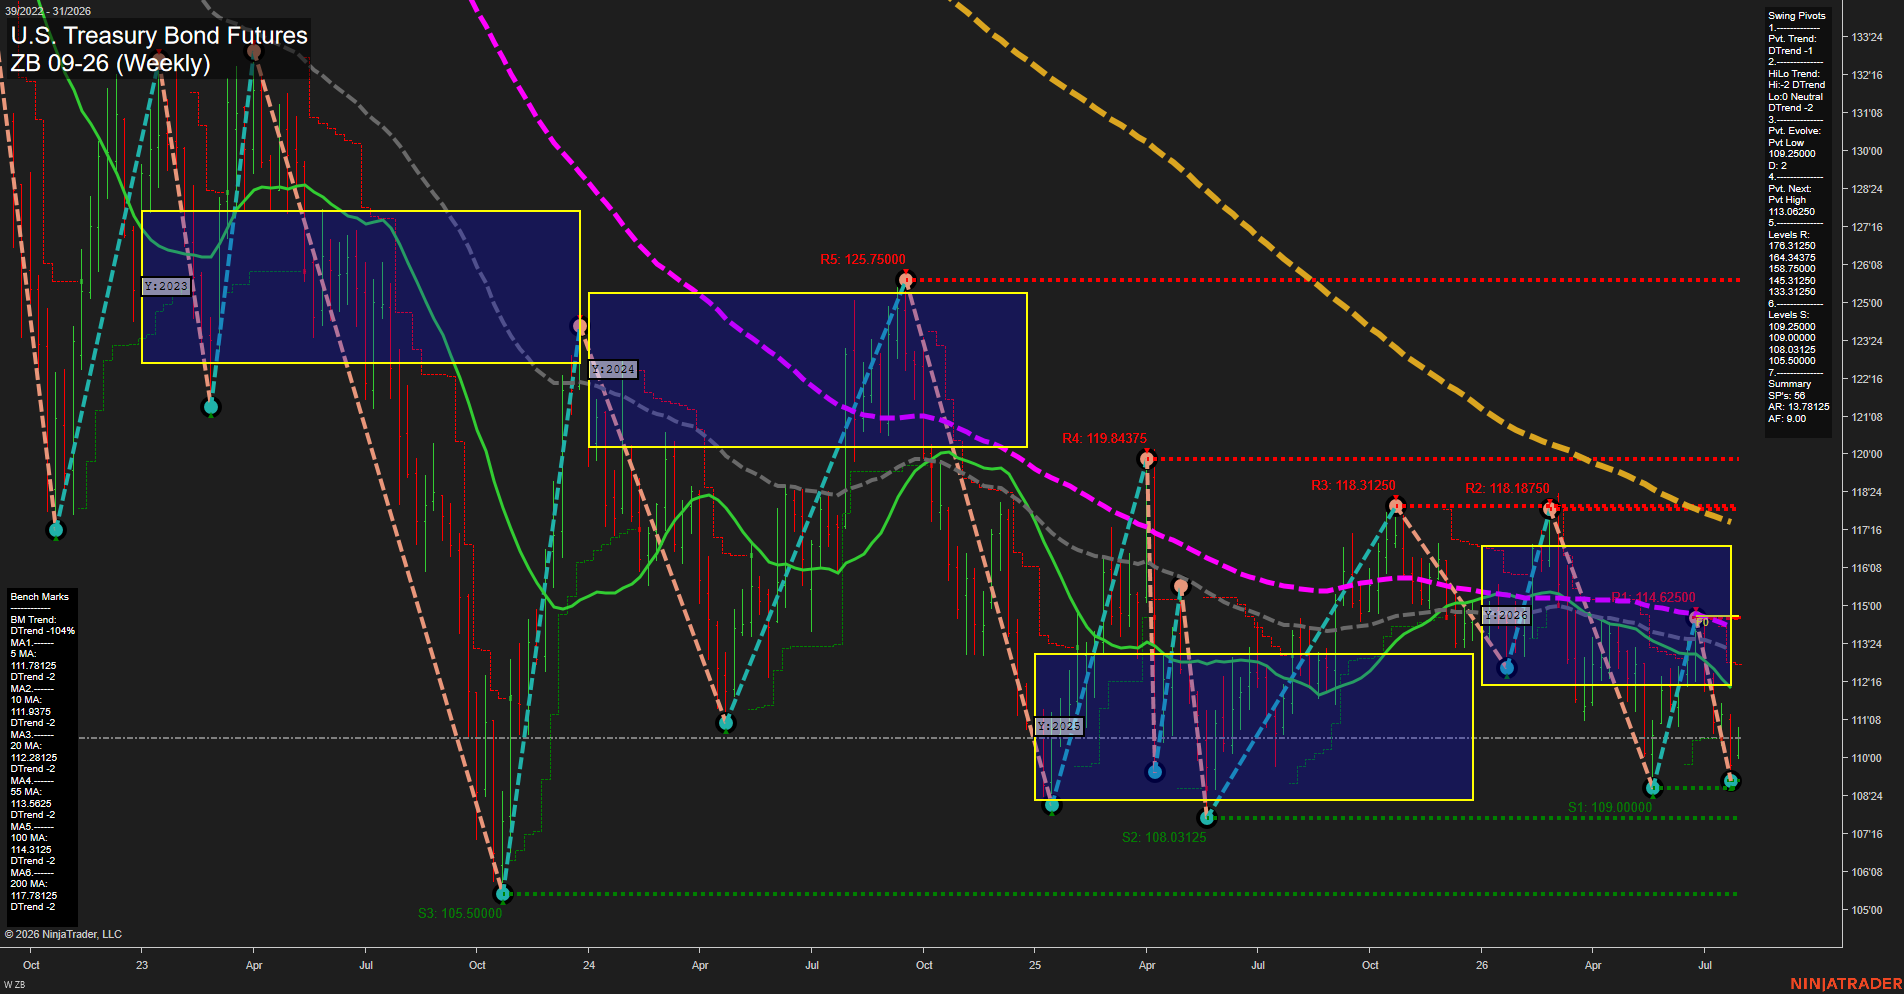
ZB U.S. Treasury Bond Futures Weekly Chart Analysis: 2026-Jul-29 07:11 CT
Price Action
- Last: 110.62500,
- Bars: Small,
- Mom: Slow.
WSFG Weekly
- Short-Term
- WSFG Current: NA%
- F0%/NTZ' Bias: Price Bearish,
- WSFG Trend: Bearish.
MSFG Month Jul
- Intermediate-Term
- MSFG Current: NA%
- F0%/NTZ' Bias: Price Bearish,
- MSFG Trend: Bearish.
YSFG Year 2026
- Long-Term
- YSFG Current: NA%
- F0%/NTZ' Bias: Price Bearish,
- YSFG Trend: Bearish.
Swing Pivots
- (Short-Term) 1. Pvt. Trend: DTrend,
- (Intermediate-Term) 2. HiLo Trend: DTrend,
- 3. Pvt. Evolve: Pvt low 109.25000,
- 4. Pvt. Next: Pvt high 113.06250,
- 5. Levels R: 176.31250, 164.34375, 158.75000, 145.31250, 133.31250,
- 6. Levels S: 109.25000, 109.00000, 108.03125, 105.50000.
Weekly Benchmarks
- (Short-Term) 5 Day: 111.78125 Down Trend,
- (Short-Term) 10 Day: 111.93750 Down Trend,
- (Intermediate-Term) 20 Day: 112.28125 Down Trend,
- (Intermediate-Term) 55 Day: 113.56250 Down Trend,
- (Long-Term) 100 Day: 114.31250 Down Trend,
- (Long-Term) 200 Day: 117.78125 Down Trend.
Overall Rating
- Short-Term: Bearish,
- Intermediate-Term: Bearish,
- Long-Term: Bearish.
Key Insights Summary
ZB remains in a broad bearish weekly structure, with price below every benchmark average and below the yearly NTZ/F0% area. Pivot structure confirms both short-term and intermediate-term DTrends, defined by lower highs and repeated tests of the 109.25000 to 109.00000 support zone. Recent bars are small and momentum is slow, indicating consolidation near the lows rather than an impulsive recovery. The 113.06250 pivot-next level and the 20-day through 100-day benchmark cluster form the principal overhead recovery zone, while a sustained break beneath 109.00000 would maintain the larger declining price cycle toward 108.03125 and 105.50000.
Chart Analysis ATS AI Generated: 2026-07-29 07:11 for Informational use only, not trading advice. Terms and Risk Disclosure Copyright © 2026. Algo Trading Systems LLC.