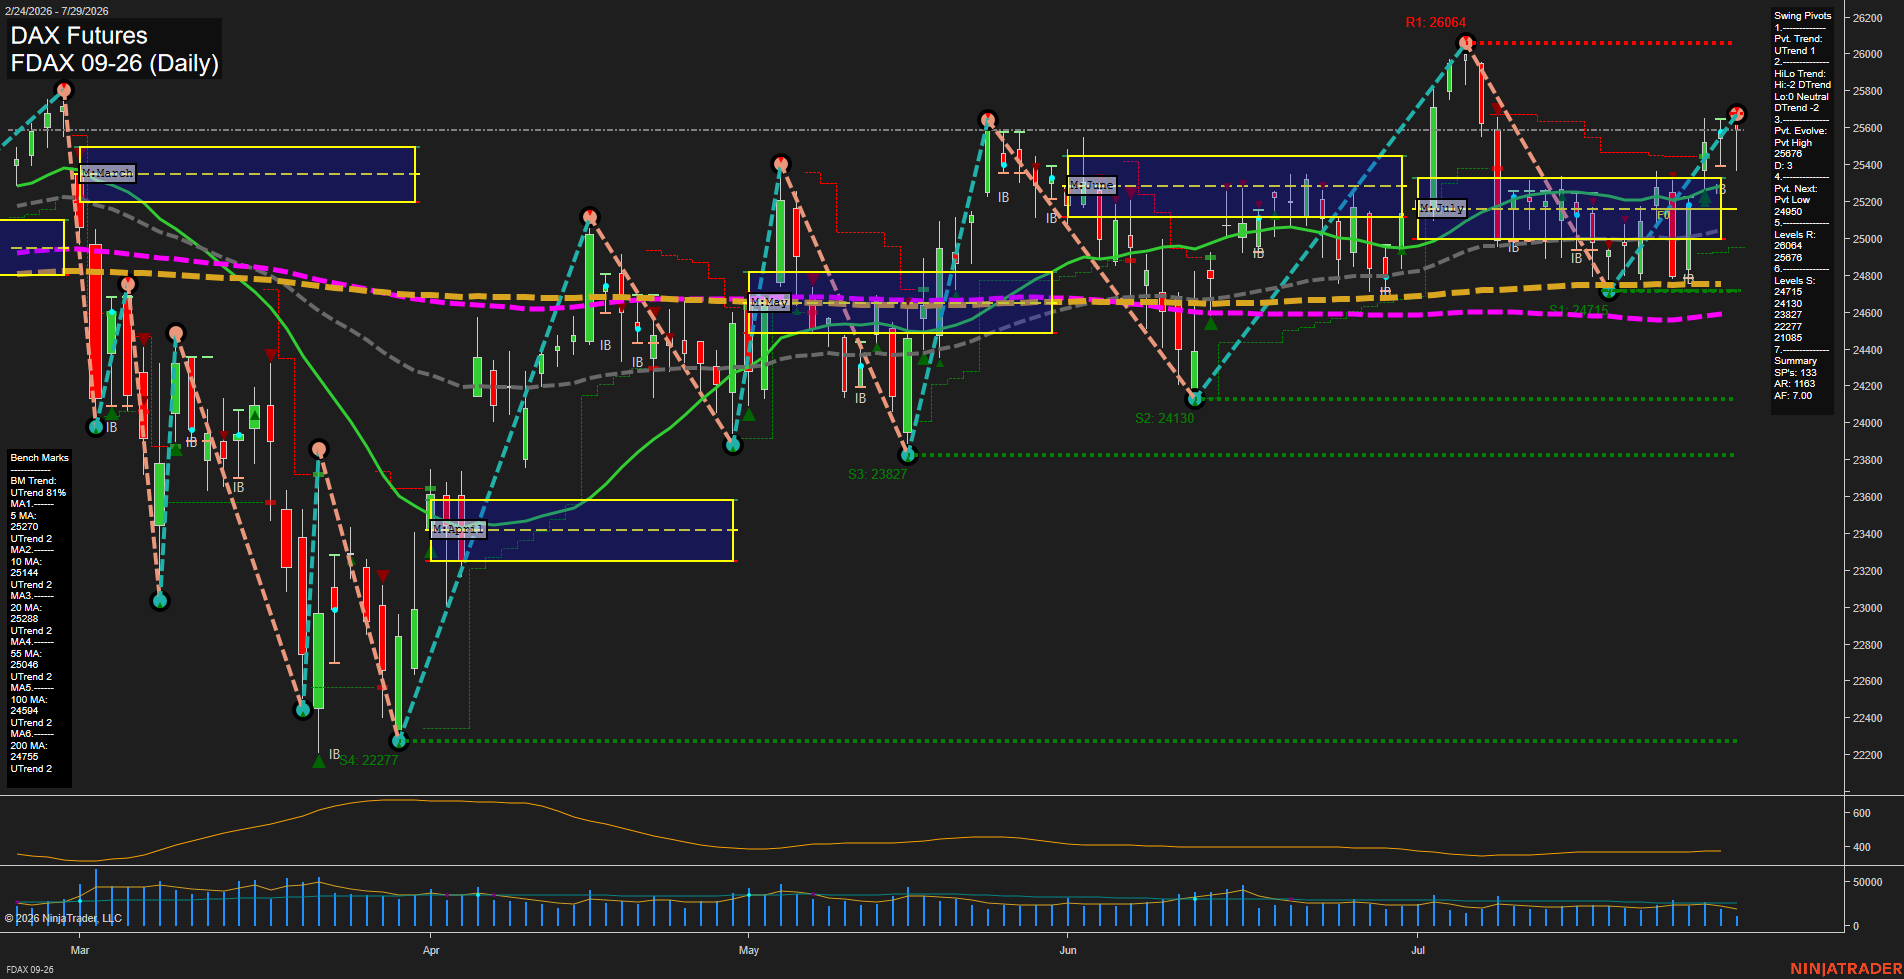
FDAX DAX Futures Daily Chart Analysis: 2026-Jul-29 07:04 CT
Price Action
- Last: 25589,
- Bars: Medium,
- Mom: fast.
WSFG Weekly
- Short-Term
- WSFG Current: 30%
- F0%/NTZ' Bias: Price Above,
- WSFG Trend: Up.
MSFG Month Jul
- Intermediate-Term
- MSFG Current: 34%
- F0%/NTZ' Bias: Price Above,
- MSFG Trend: Up.
YSFG Year 2026
- Long-Term
- YSFG Current: 22%
- F0%/NTZ' Bias: Price Above,
- YSFG Trend: Up.
Swing Pivots
- (Short-Term) 1. Pvt. Trend: UTrend,
- (Intermediate-Term) 2. HiLo Trend: DTrend,
- 3. Pvt. Evolve: Pvt high 25676,
- 4. Pvt. Next: Pvt low 24800,
- 5. Levels R: 26064, 25676,
- 6. Levels S: 24715, 24130, 23827, 22277, 21085.
Daily Benchmarks
- (Short-Term) 5 Day: 25270 Up Trend,
- (Short-Term) 10 Day: 25254 Up Trend,
- (Intermediate-Term) 20 Day: 25288 Up Trend,
- (Intermediate-Term) 55 Day: 25040 Up Trend,
- (Long-Term) 100 Day: 24594 Up Trend,
- (Long-Term) 200 Day: 24755 Up Trend.
Additional Metrics
Recent Trade Signals
- 29 Jul 2026: Long FDAX 09-26 @ 25477 Signals.USAR-MSFG
- 28 Jul 2026: Long FDAX 09-26 @ 25548 Signals.USAR-WSFG
- 24 Jul 2026: Long FDAX 09-26 @ 25204 Signals.USAR.TR120
Overall Rating
- Short-Term: Bullish,
- Intermediate-Term: Bullish,
- Long-Term: Bullish.
Key Insights Summary
Price has resumed a short-term upswing from the late-July pullback, holding above the weekly and monthly Fib-grid centers and above all benchmark averages. The current pivot sequence is bullish, with price pressing the 25676 pivot resistance beneath the larger 26064 resistance level. Intermediate pivot structure remains DTrend, reflecting the prior decline from the early-July 26064 high, but the broad moving-average alignment and rising monthly structure retain a constructive longer-term profile. The 24715 support area remains the principal swing reference beneath the recent higher-low recovery.
Chart Analysis ATS AI Generated: 2026-07-29 07:04 for Informational use only, not trading advice. Terms and Risk Disclosure Copyright © 2026. Algo Trading Systems LLC.