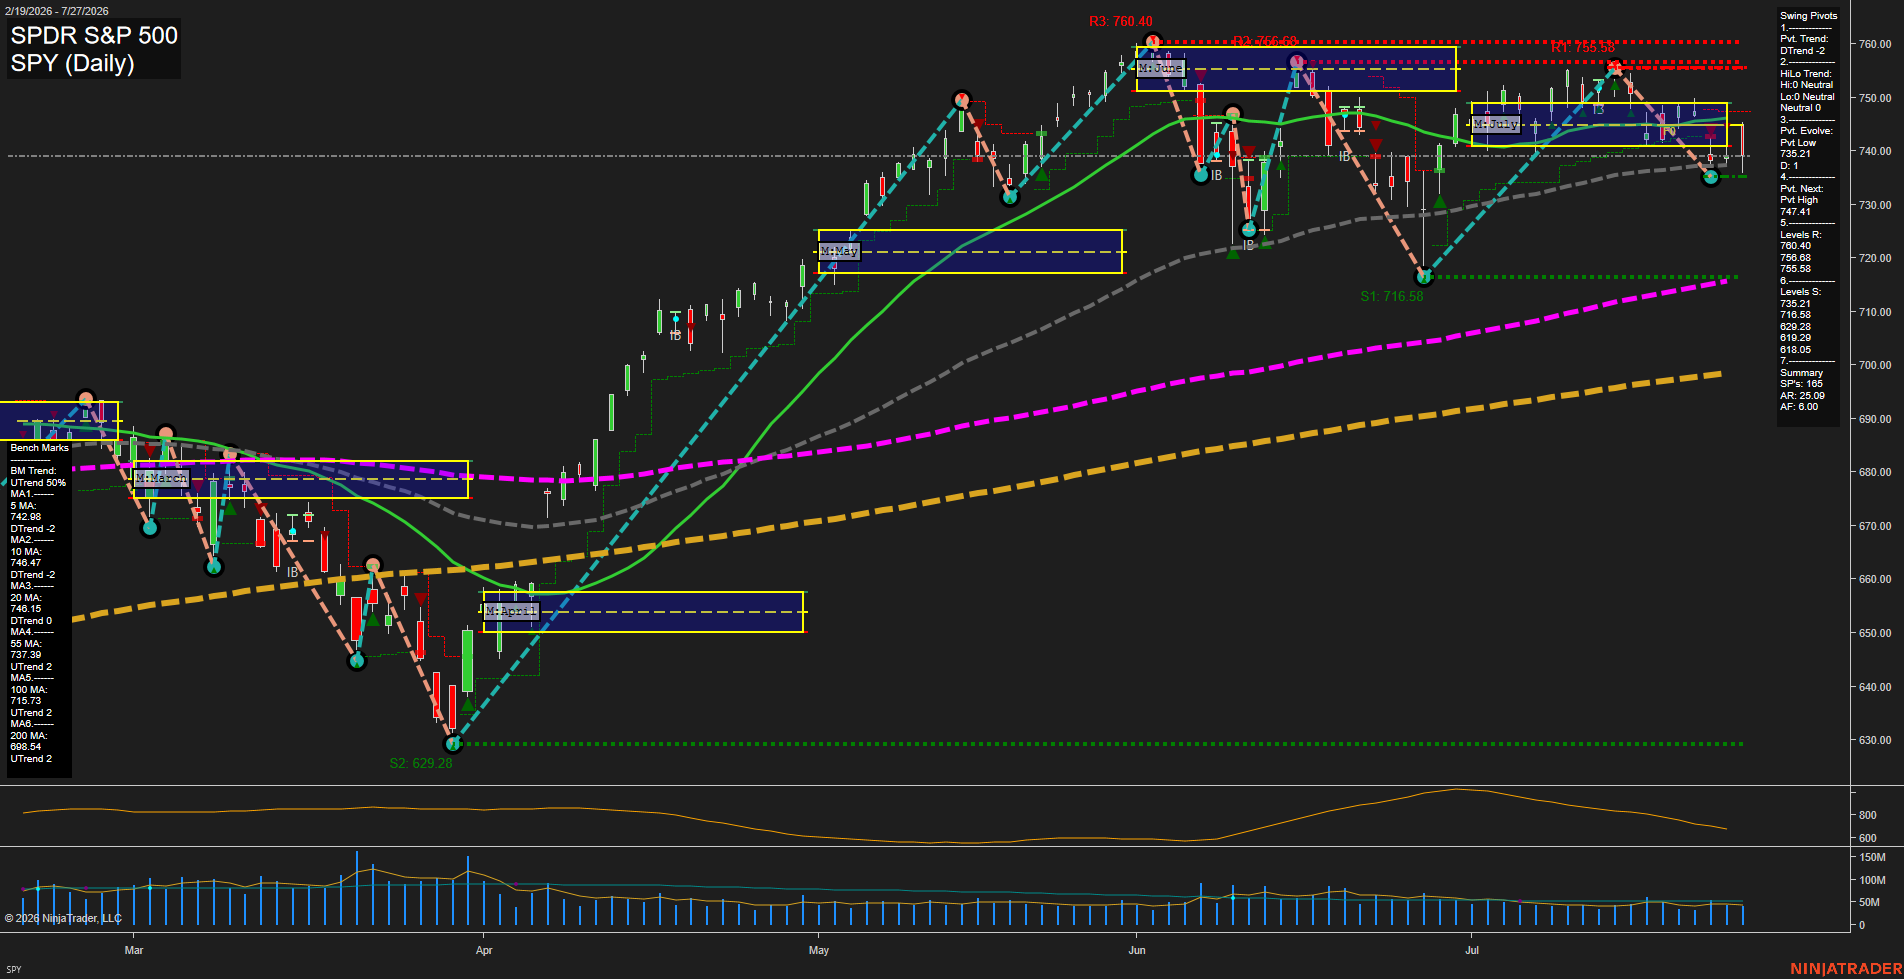
SPY SPDR S&P 500 Daily Chart Analysis: 2026-Jul-28 07:09 CT
Price Action
- Last: 743.21,
- Bars: Small,
- Mom: Slow.
WSFG Weekly
- Short-Term
- WSFG Current: NA%
- F0%/NTZ' Bias: Price Neutral,
- WSFG Trend: Neutral.
MSFG Month Jul
- Intermediate-Term
- MSFG Current: NA%
- F0%/NTZ' Bias: Price Bearish,
- MSFG Trend: Bearish.
YSFG Year 2026
- Long-Term
- YSFG Current: NA%
- F0%/NTZ' Bias: Price Neutral,
- YSFG Trend: Neutral.
Swing Pivots
- (Short-Term) 1. Pvt. Trend: DTrend,
- (Intermediate-Term) 2. HiLo Trend: Neutral,
- 3. Pvt. Evolve: Pvt low 735.21,
- 4. Pvt. Next: Pvt high 747.41,
- 5. Levels R: 760.40, 756.68, 755.58,
- 6. Levels S: 735.21, 716.58, 629.28, 619.29, 618.05.
Daily Benchmarks
- (Short-Term) 5 Day: 742.98 Down Trend,
- (Short-Term) 10 Day: 746.47 Down Trend,
- (Intermediate-Term) 20 Day: 746.15 Down Trend,
- (Intermediate-Term) 55 Day: 737.39 Up Trend,
- (Long-Term) 100 Day: 715.73 Up Trend,
- (Long-Term) 200 Day: 698.54 Up Trend.
Additional Metrics
- ATR: 25.09,
- VOLMA: 47470907.
Overall Rating
- Short-Term: Bearish,
- Intermediate-Term: Neutral,
- Long-Term: Bullish.
Key Insights Summary
SPY futures-equivalent price action is consolidating below the declining 10-day and 20-day benchmarks after rejection from the 755.58-760.40 resistance band. The short-term pivot structure remains in DTrend, while 735.21 is the active pivot-low reference and 747.41 defines the opposite-pivot reversal level. Intermediate structure is mixed: price remains above the rising 55-day average but below the near-term averages and July grid area. The longer-term structure remains constructive above rising 100-day and 200-day averages, while the 25.09 ATR reflects a still-material daily range environment.
Chart Analysis ATS AI Generated: 2026-07-28 07:09 for Informational use only, not trading advice. Terms and Risk Disclosure Copyright © 2026. Algo Trading Systems LLC.