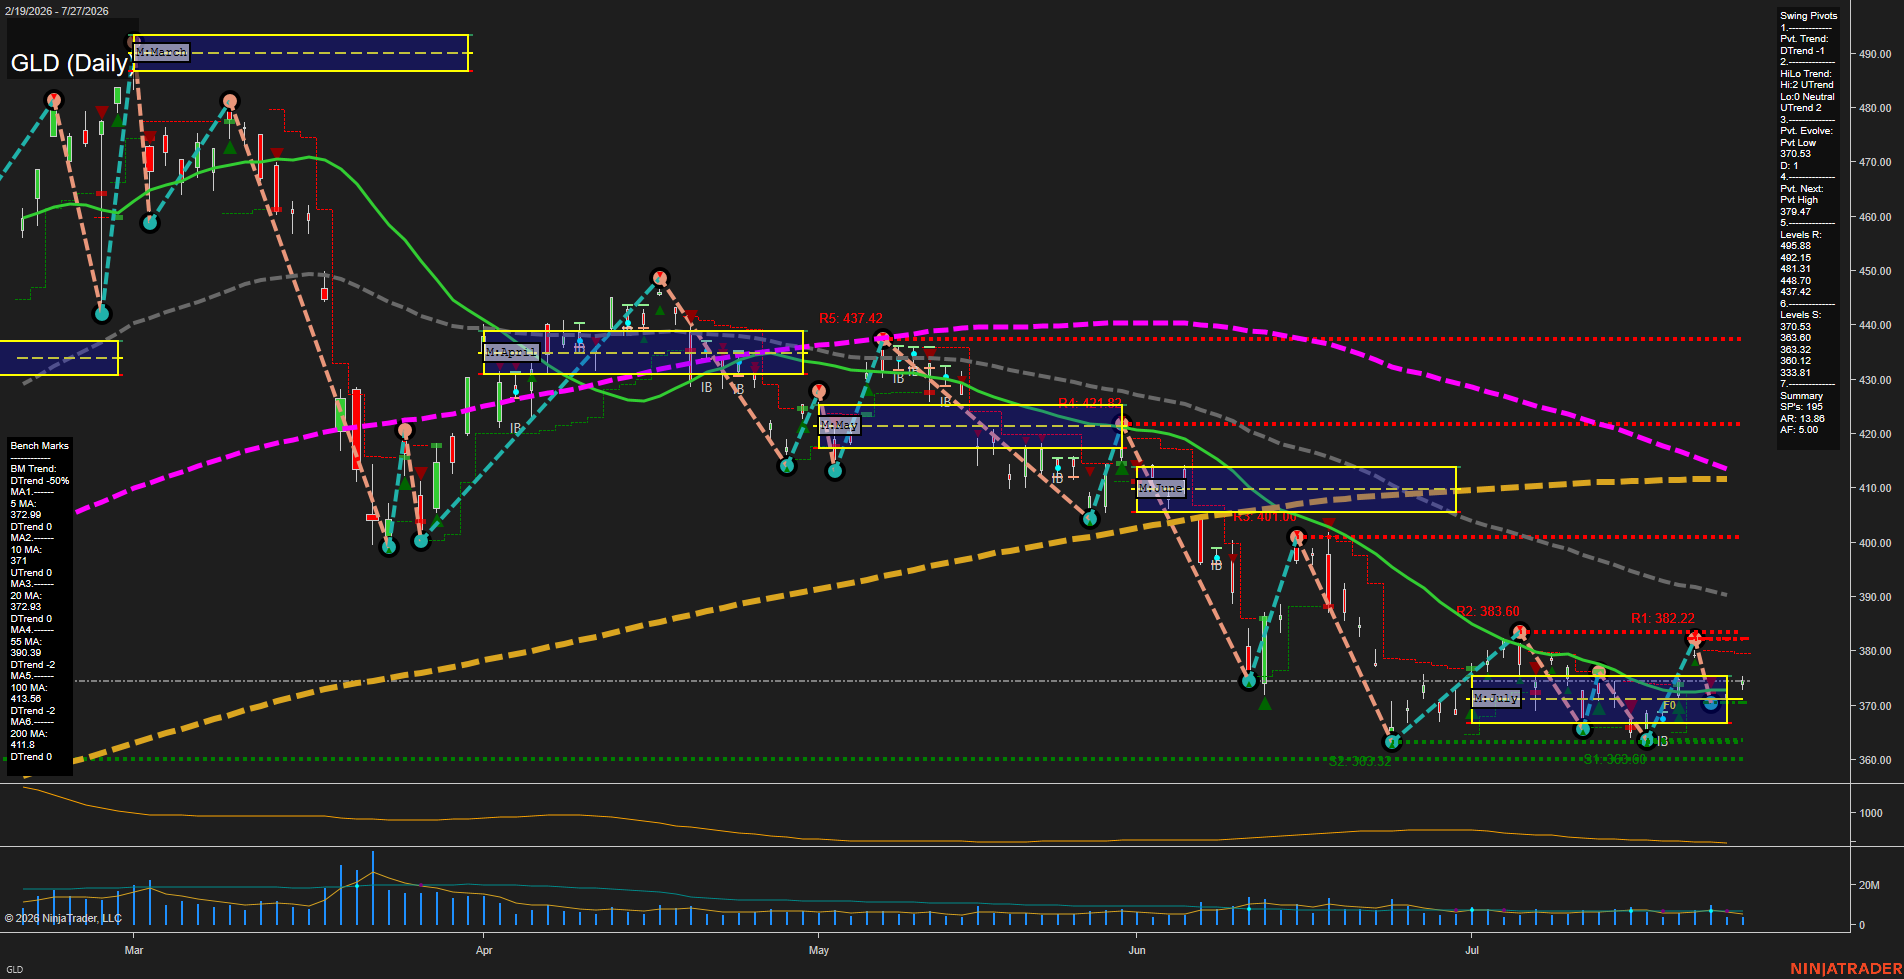
GLD SPDR Gold Shares Daily Chart Analysis: 2026-Jul-28 07:05 CT
Price Action
- Last: 374.19,
- Bars: Small,
- Mom: slow.
WSFG Weekly
- Short-Term
- WSFG Current: NA%
- F0%/NTZ' Bias: Price Neutral,
- WSFG Trend: Neutral.
MSFG Month Jul
- Intermediate-Term
- MSFG Current: NA%
- F0%/NTZ' Bias: Price Neutral,
- MSFG Trend: Neutral.
YSFG Year 2026
- Long-Term
- YSFG Current: NA%
- F0%/NTZ' Bias: Price Neutral,
- YSFG Trend: Neutral.
Swing Pivots
- (Short-Term) 1. Pvt. Trend: DTrend,
- (Intermediate-Term) 2. HiLo Trend: UTrend,
- 3. Pvt. Evolve: Pvt low 370.53,
- 4. Pvt. Next: Pvt high 379.47,
- 5. Levels R: 495.38, 492.15, 481.31, 449.70, 437.42,
- 6. Levels S: 370.53, 366.80, 363.32, 360.12, 333.81.
Daily Benchmarks
- (Short-Term) 5 Day: 372.99 Down Trend,
- (Short-Term) 10 Day: 371.43 Down Trend,
- (Intermediate-Term) 20 Day: 372.93 Down Trend,
- (Intermediate-Term) 55 Day: 390.39 Down Trend,
- (Long-Term) 100 Day: 417.68 Down Trend,
- (Long-Term) 200 Day: 411.88 Down Trend.
Additional Metrics
- ATR: 159,
- VOLMA: 7207880.
Overall Rating
- Short-Term: Bearish,
- Intermediate-Term: Bearish,
- Long-Term: Bearish.
Key Insights Summary
GLD is consolidating around the July monthly grid after a sharp multi-month decline, with small candles and slow momentum reflecting compressed swing activity. The short-term pivot remains in DTrend, while the evolving low at 370.53 and the 379.47 next-pivot threshold define the immediate range. Price is beneath the declining 55-, 100-, and 200-day benchmarks, preserving the broader bearish futures-swing structure despite the intermediate HiLo UTrend reading. Support is concentrated from 370.53 through 360.12, while 379.47 is the nearest pivot reference before the larger resistance zone near 382.22 and 383.60.
Chart Analysis ATS AI Generated: 2026-07-28 07:05 for Informational use only, not trading advice. Terms and Risk Disclosure Copyright © 2026. Algo Trading Systems LLC.