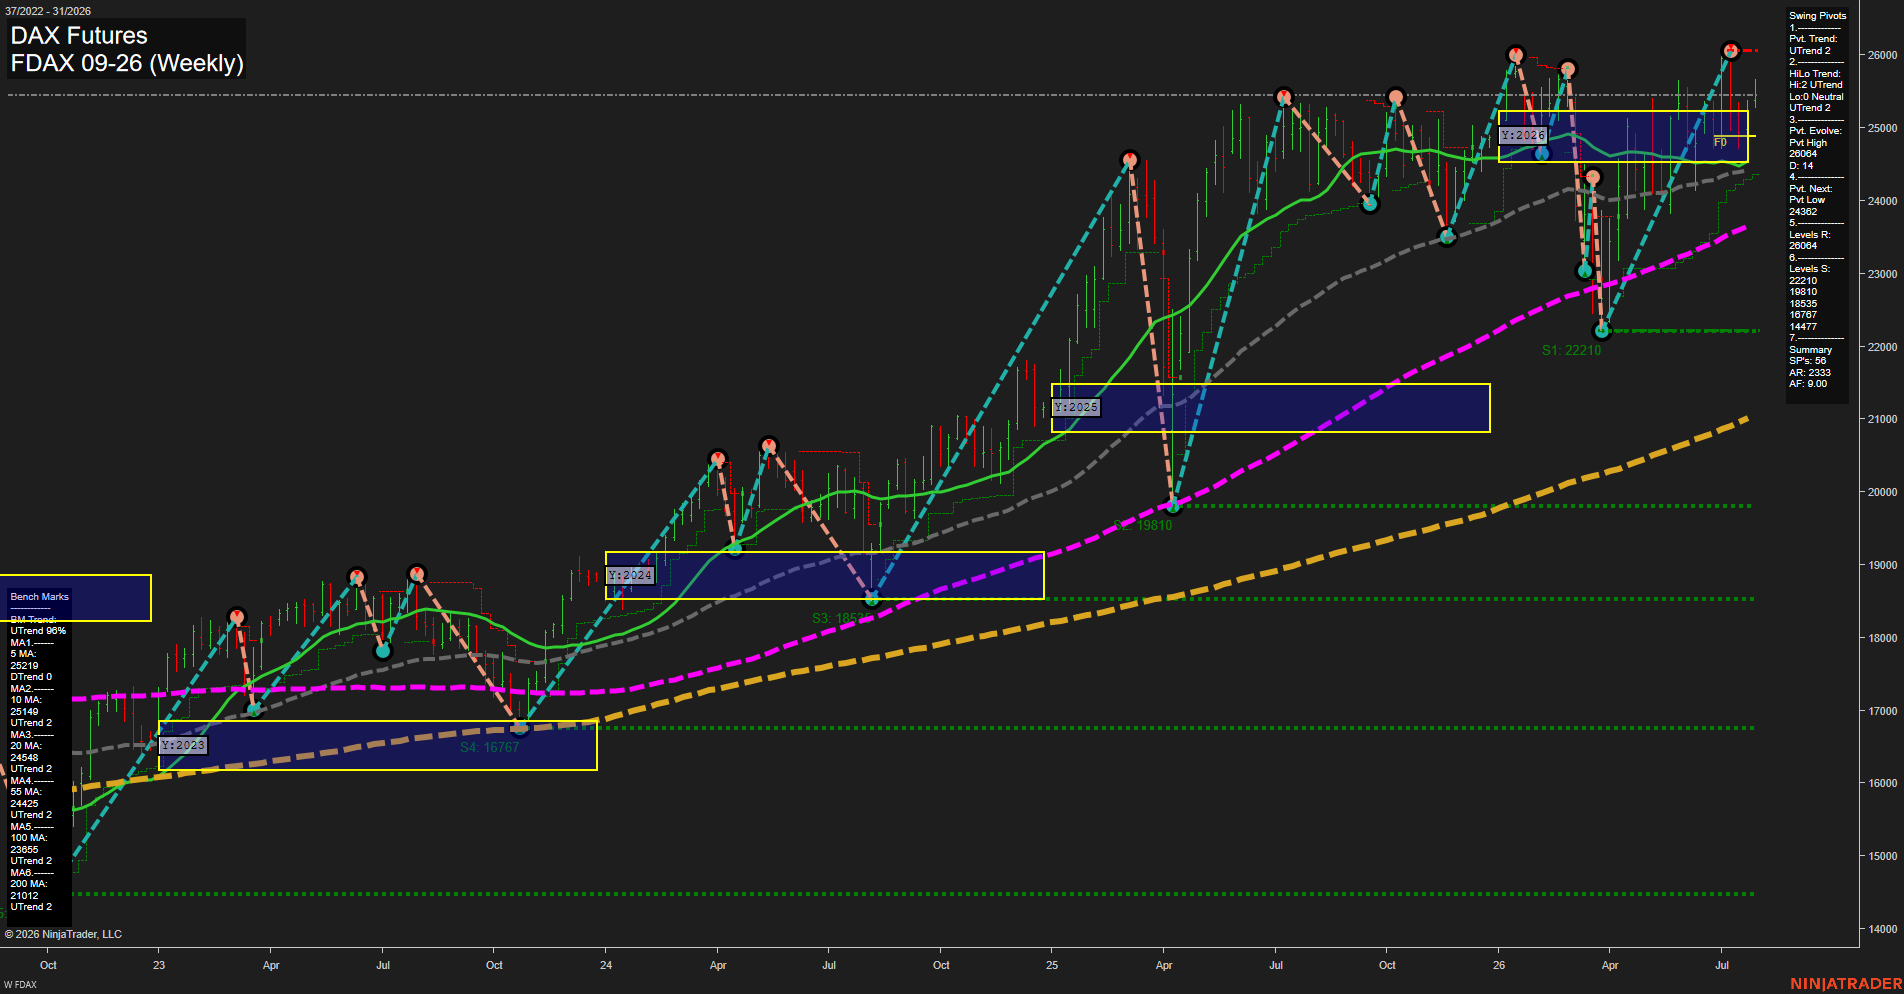
FDAX DAX Futures Weekly Chart Analysis: 2026-Jul-28 07:04 CT
Price Action
- Last: 25548,
- Bars: Small,
- Mom: Momentum average.
WSFG Weekly
- Short-Term
- WSFG Current: 14%
- F0%/NTZ' Bias: Price Above,
- WSFG Trend: Up.
MSFG Month Jul
- Intermediate-Term
- MSFG Current: 23%
- F0%/NTZ' Bias: Price Above,
- MSFG Trend: Up.
YSFG Year 2026
- Long-Term
- YSFG Current: 17%
- F0%/NTZ' Bias: Price Above,
- YSFG Trend: Up.
Swing Pivots
- (Short-Term) 1. Pvt. Trend: UTrend,
- (Intermediate-Term) 2. HiLo Trend: UTrend,
- 3. Pvt. Evolve: Pvt high 26064,
- 4. Pvt. Next: Pvt low 24362,
- 5. Levels R: 26064,
- 6. Levels S: 22210, 19810, 18535, 17676, 14477.
Weekly Benchmarks
- (Short-Term) 5 Day: 25214 Up Trend,
- (Short-Term) 10 Day: 25149 Up Trend,
- (Intermediate-Term) 20 Day: 24544 Up Trend,
- (Intermediate-Term) 55 Day: 24423 Up Trend,
- (Long-Term) 100 Day: 23655 Up Trend,
- (Long-Term) 200 Day: 21012 Up Trend.
Recent Trade Signals
- 28 Jul 2026: Long FDAX 09-26 @ 25548 Signals.USAR-WSFG
- 27 Jul 2026: Long FDAX 09-26 @ 25450 Signals.USAR-MSFG
- 24 Jul 2026: Long FDAX 09-26 @ 25204 Signals.USAR.TR120
Overall Rating
- Short-Term: Bullish,
- Intermediate-Term: Bullish,
- Long-Term: Bullish.
Key Insights Summary
FDAX remains in a broad weekly uptrend, with price above every benchmark average and all averages rising. The swing structure retains higher highs and higher lows, while the latest advance is testing the 26064 pivot-high resistance area. Small weekly bars near the highs indicate consolidation and average momentum rather than a decisive acceleration. The 24362 reversal level defines the current short-term pivot structure, while the yearly, monthly, and weekly fib-grid readings remain above their respective F0% areas and preserve aligned bullish trend conditions.
Chart Analysis ATS AI Generated: 2026-07-28 07:04 for Informational use only, not trading advice. Terms and Risk Disclosure Copyright © 2026. Algo Trading Systems LLC.