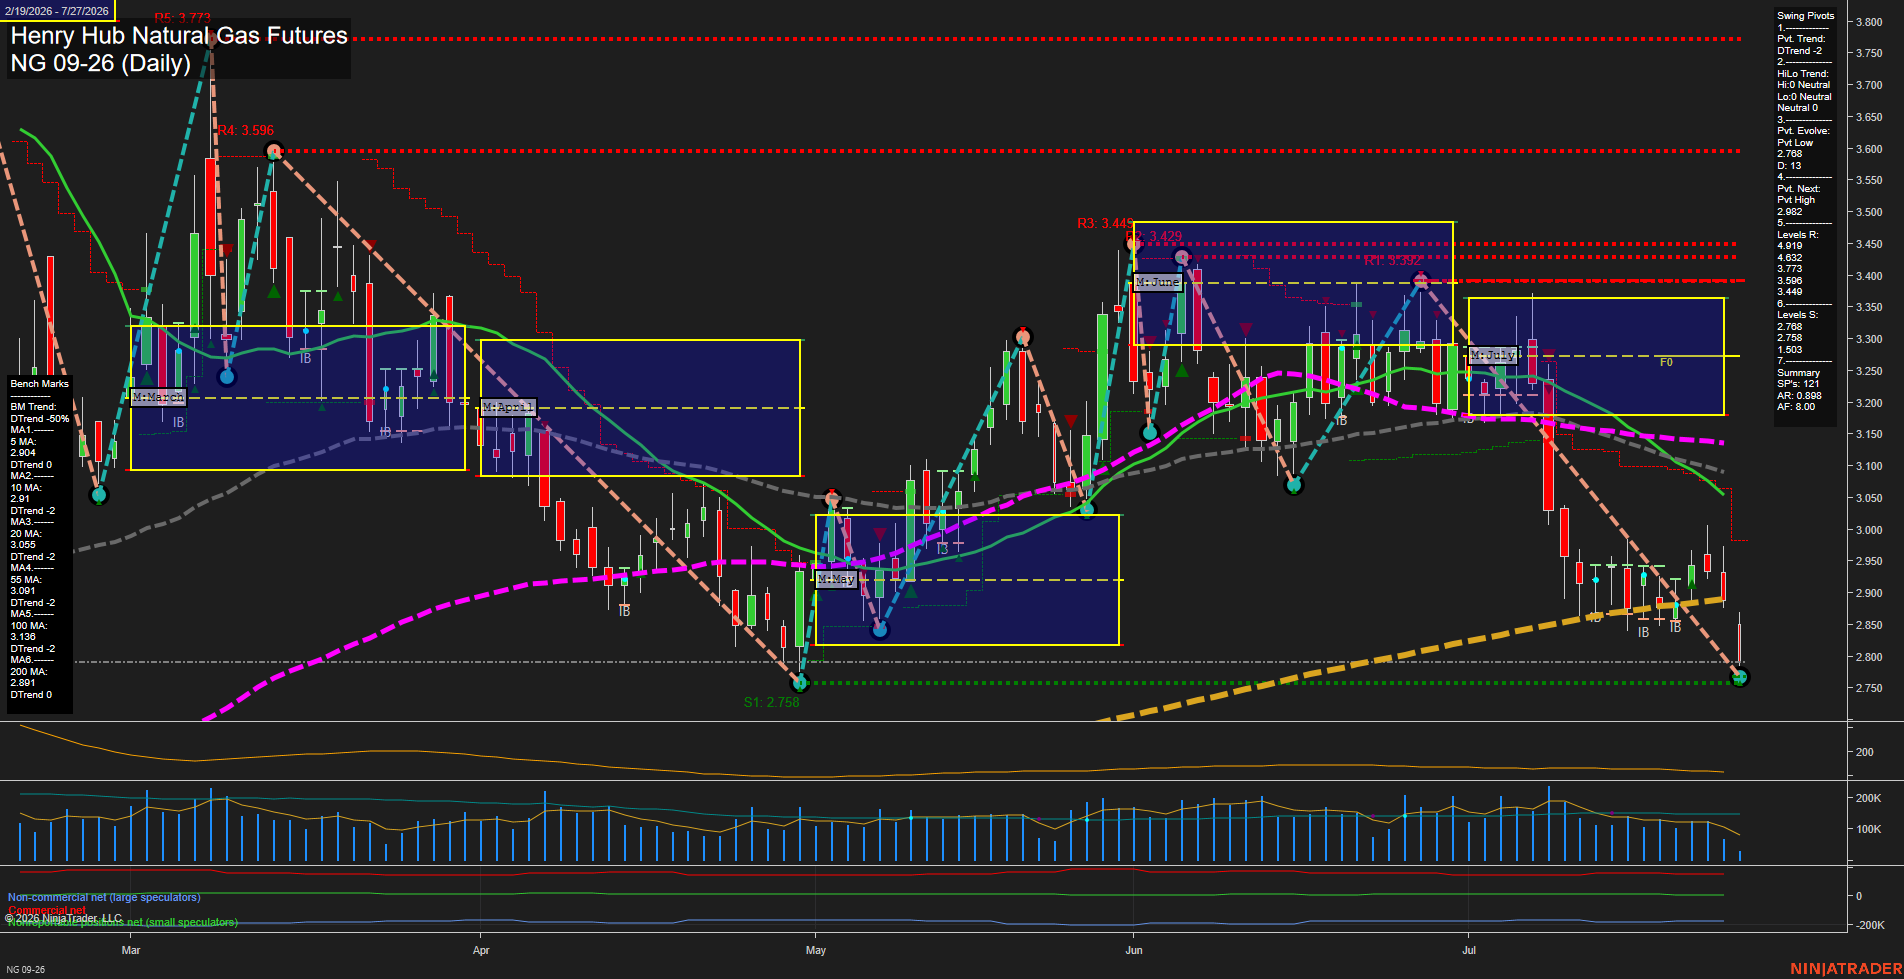
NG Henry Hub Natural Gas Futures Daily Chart Analysis: 2026-Jul-27 07:05 CT
Price Action
- Last: 2.798,
- Bars: Large,
- Mom: fast.
WSFG Weekly
- Short-Term
- WSFG Current: -14%
- F0%/NTZ' Bias: Price Below,
- WSFG Trend: Down.
MSFG Month Jul
- Intermediate-Term
- MSFG Current: -117%
- F0%/NTZ' Bias: Price Below,
- MSFG Trend: Down.
YSFG Year 2026
- Long-Term
- YSFG Current: 13%
- F0%/NTZ' Bias: Price Above,
- YSFG Trend: Up.
Swing Pivots
- (Short-Term) 1. Pvt. Trend: DTrend,
- (Intermediate-Term) 2. HiLo Trend: DTrend,
- 3. Pvt. Evolve: Pvt low 2.768,
- 4. Pvt. Next: Pvt high 2.982,
- 5. Levels R: 4.932, 4.673, 3.773, 3.596, 3.449,
- 6. Levels S: 2.768, 2.758.
Daily Benchmarks
- (Short-Term) 5 Day: 2.904 Down Trend,
- (Short-Term) 10 Day: 2.910 Down Trend,
- (Intermediate-Term) 20 Day: 3.059 Down Trend,
- (Intermediate-Term) 55 Day: 3.091 Down Trend,
- (Long-Term) 100 Day: 3.149 Down Trend,
- (Long-Term) 200 Day: 2.891 Down Trend.
Additional Metrics
Recent Trade Signals
- 27 Jul 2026: Short NG 09-26 @ 2.78 Signals.USAR-WSFG
- 22 Jul 2026: Long NG 08-26 @ 2.93 Signals.USAR.TR120
Overall Rating
- Short-Term: Bearish,
- Intermediate-Term: Bearish,
- Long-Term: Neutral.
Key Insights Summary
Price is in a fast downside swing, trading below the weekly and monthly Fib-grid centers and beneath every listed daily benchmark. The pivot structure remains short-term bearish with a new pivot low at 2.768 and a lower-high reversal threshold near 2.982. The July decline has accelerated from the 3.40 area toward the 2.76-2.80 support band, while overhead structure remains layered with major resistance beginning at 3.449. The yearly grid remains positive, creating a longer-cycle countertrend backdrop, but daily long-term moving-average alignment is still negative and keeps the broader chart condition neutral rather than bullish.
Chart Analysis ATS AI Generated: 2026-07-27 07:05 for Informational use only, not trading advice. Terms and Risk Disclosure Copyright © 2026. Algo Trading Systems LLC.