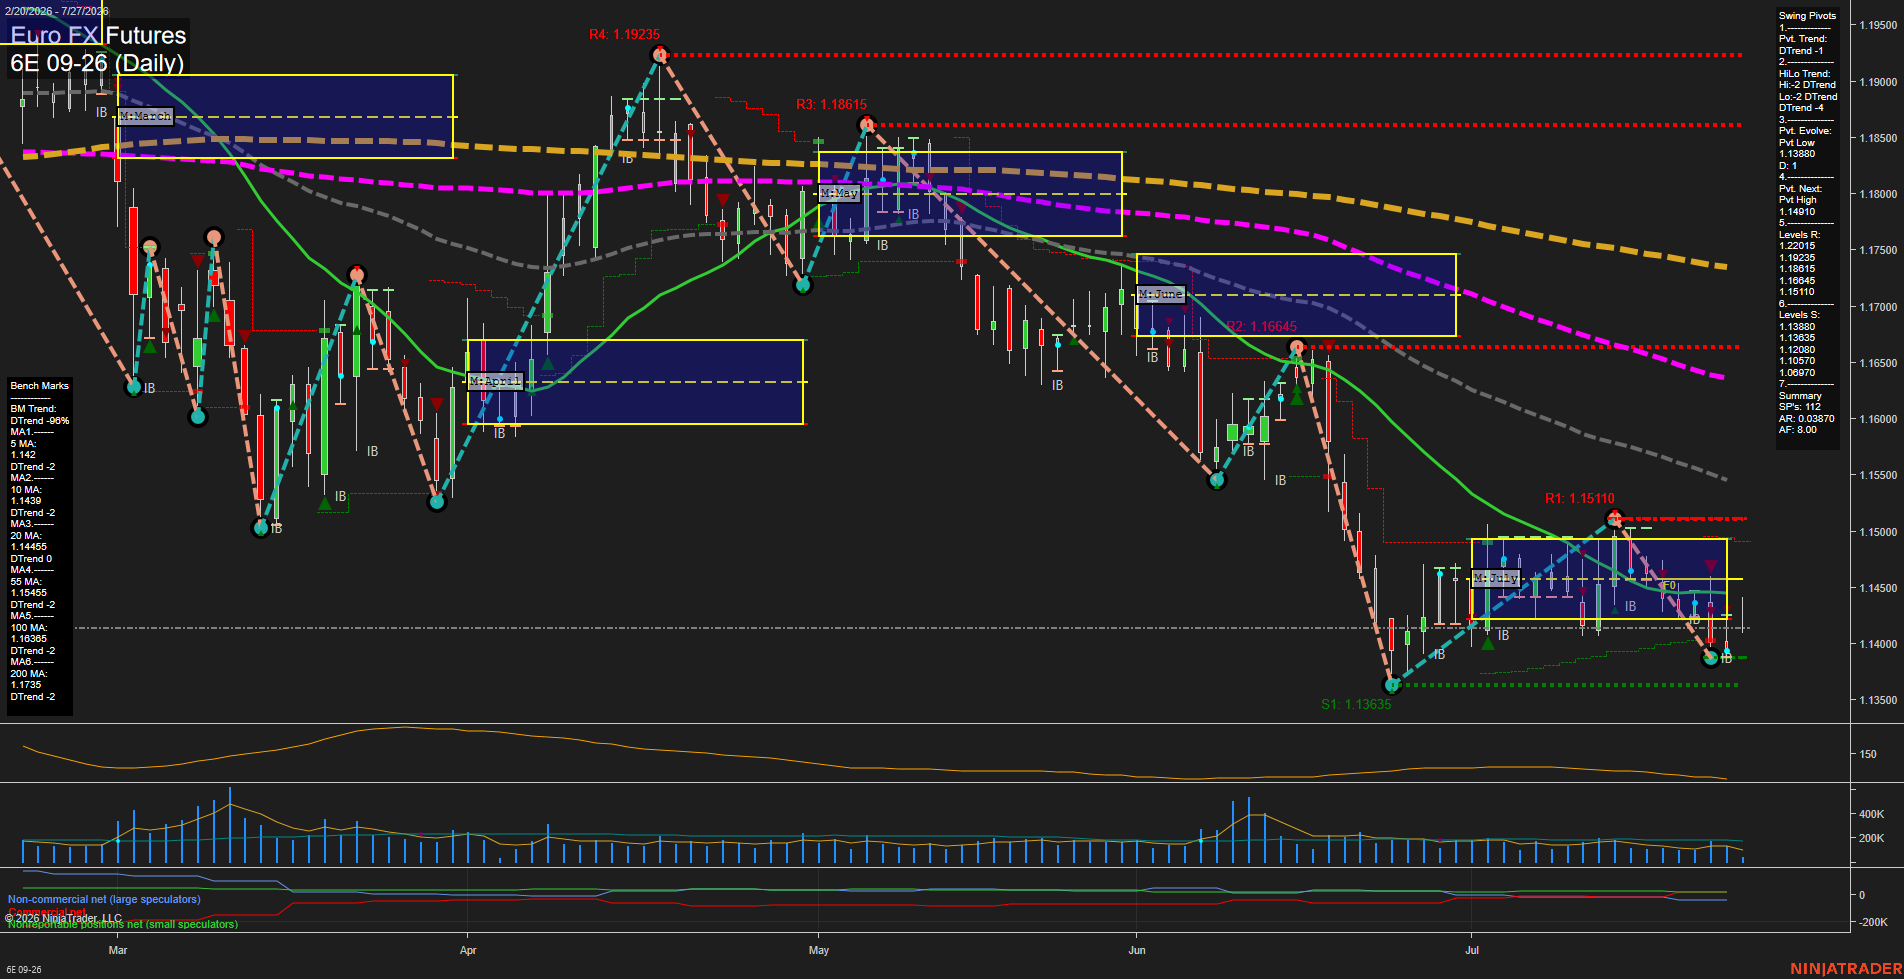
6E Euro FX Futures Daily Chart Analysis: 2026-Jul-27 07:01 CT
Price Action
- Last: 1.1426,
- Bars: Small,
- Mom: Slow.
WSFG Weekly
- Short-Term
- WSFG Current: 2%
- F0%/NTZ' Bias: Price Above,
- WSFG Trend: Up.
MSFG Month Jul
- Intermediate-Term
- MSFG Current: -11%
- F0%/NTZ' Bias: Price Below,
- MSFG Trend: Down.
YSFG Year 2026
- Long-Term
- YSFG Current: -37%
- F0%/NTZ' Bias: Price Below,
- YSFG Trend: Down.
Swing Pivots
- (Short-Term) 1. Pvt. Trend: DTrend,
- (Intermediate-Term) 2. HiLo Trend: DTrend,
- 3. Pvt. Evolve: Pvt low 1.1380,
- 4. Pvt. Next: Pvt high 1.14109,
- 5. Levels R: 1.22015, 1.19235, 1.18615, 1.18105, 1.15110,
- 6. Levels S: 1.13880, 1.13835, 1.12080, 1.10570, 1.06970.
Daily Benchmarks
- (Short-Term) 5 Day: 1.1422 Down Trend,
- (Short-Term) 10 Day: 1.1439 Down Trend,
- (Intermediate-Term) 20 Day: 1.1445 Down Trend,
- (Intermediate-Term) 55 Day: 1.1545 Down Trend,
- (Long-Term) 100 Day: 1.1685 Down Trend,
- (Long-Term) 200 Day: 1.1735 Down Trend.
Additional Metrics
Recent Trade Signals
- 27 Jul 2026: Long 6E 09-26 @ 1.1426 Signals.USAR-WSFG
- 27 Jul 2026: Long 6E 09-26 @ 1.1428 Signals.USAR.TR120
- 24 Jul 2026: Short 6E 09-26 @ 1.1402 Signals.USAR-MSFG
Overall Rating
- Short-Term: Neutral,
- Intermediate-Term: Bearish,
- Long-Term: Bearish.
Key Insights Summary
The daily chart remains in a broader bearish structure, with both pivot trend measures down and price below the 10, 20, 55, 100, and 200-day benchmarks. A late-July bounce developed from the 1.13635 swing low, but the rebound has stalled beneath the declining 20-day average and the 1.15110 pivot resistance. Short-term conditions are mixed: price is marginally above the weekly F0% area and recent short-term signals are long, while the July monthly grid, intermediate pivot structure, and benchmark alignment remain negative. The narrow, small-bar consolidation around 1.1400 to 1.1450 reflects slow momentum and reduced directional conviction following the sharp June-July selloff. The 1.13880 and 1.13835 support cluster defines the nearby downside reference, while sustained trade above 1.15110 would be needed to materially improve the daily swing structure.
Chart Analysis ATS AI Generated: 2026-07-27 07:01 for Informational use only, not trading advice. Terms and Risk Disclosure Copyright © 2026. Algo Trading Systems LLC.