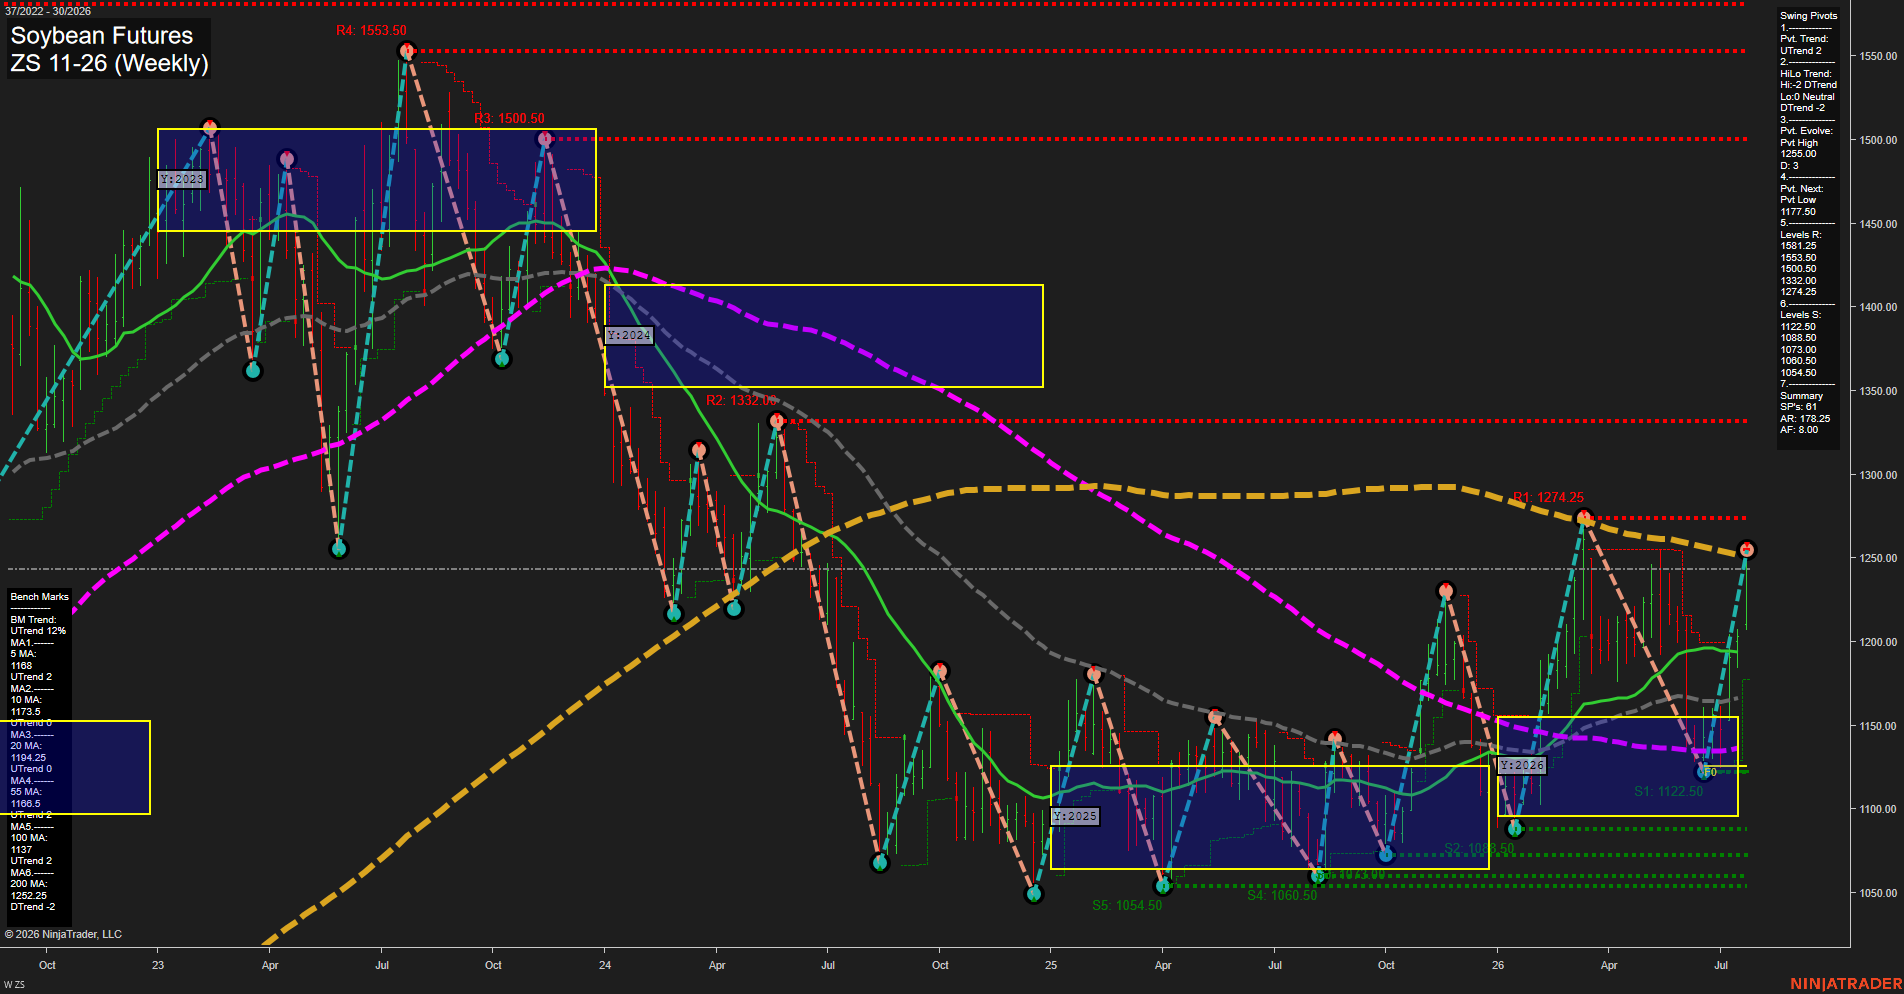
ZS Soybean Futures Weekly Chart Analysis: 2026-Jul-24 07:11 CT
Price Action
- Last: 1252.25,
- Bars: Medium,
- Mom: fast.
WSFG Weekly
- Short-Term
- WSFG Current: 96%
- F0%/NTZ' Bias: Price Above,
- WSFG Trend: Up.
MSFG Month Jul
- Intermediate-Term
- MSFG Current: 165%
- F0%/NTZ' Bias: Price Above,
- MSFG Trend: Up.
YSFG Year 2026
- Long-Term
- YSFG Current: 40%
- F0%/NTZ' Bias: Price Above,
- YSFG Trend: Up.
Swing Pivots
- (Short-Term) 1. Pvt. Trend: UTrend,
- (Intermediate-Term) 2. HiLo Trend: DTrend,
- 3. Pvt. Evolve: Pvt high 1250.00,
- 4. Pvt. Next: Pvt low 1117.50,
- 5. Levels R: 1581.25, 1553.50, 1500.50, 1332.00, 1274.25,
- 6. Levels S: 1122.50, 1088.50, 1073.00, 1060.50, 1054.50.
Weekly Benchmarks
- (Short-Term) 5 Day: 1168.00 Up Trend,
- (Short-Term) 10 Day: 1173.50 Up Trend,
- (Intermediate-Term) 20 Day: 1194.25 Up Trend,
- (Intermediate-Term) 55 Day: 1168.50 Up Trend,
- (Long-Term) 100 Day: 1137.00 Up Trend,
- (Long-Term) 200 Day: 1252.25 Down Trend.
Recent Trade Signals
- 20 Jul 2026: Long ZS 11-26 @ 1212.5 Signals.USAR.TR120
- 16 Jul 2026: Long ZS 11-26 @ 1205 Signals.USAR-WSFG
Overall Rating
- Short-Term: Bullish,
- Intermediate-Term: Bullish,
- Long-Term: Bullish.
Key Insights Summary
Price has produced a sharp weekly recovery from the 1117.50 pivot-low area and is now testing the 1250.00 pivot-high zone and 1274.25 first resistance. Short-term structure is bullish, supported by an UTrend pivot reading, rising benchmark averages, and recent long signals. The intermediate HiLo trend remains DTrend, reflecting the broader sequence of lower highs from the 2024 peak; a sustained move through 1274.25 would improve that larger swing structure. The 200-period benchmark at 1252.25 is a major overhead trend reference, while 1194.25 and the 1122.50 support level define the nearest lower swing structure.
Chart Analysis ATS AI Generated: 2026-07-24 07:11 for Informational use only, not trading advice. Terms and Risk Disclosure Copyright © 2026. Algo Trading Systems LLC.