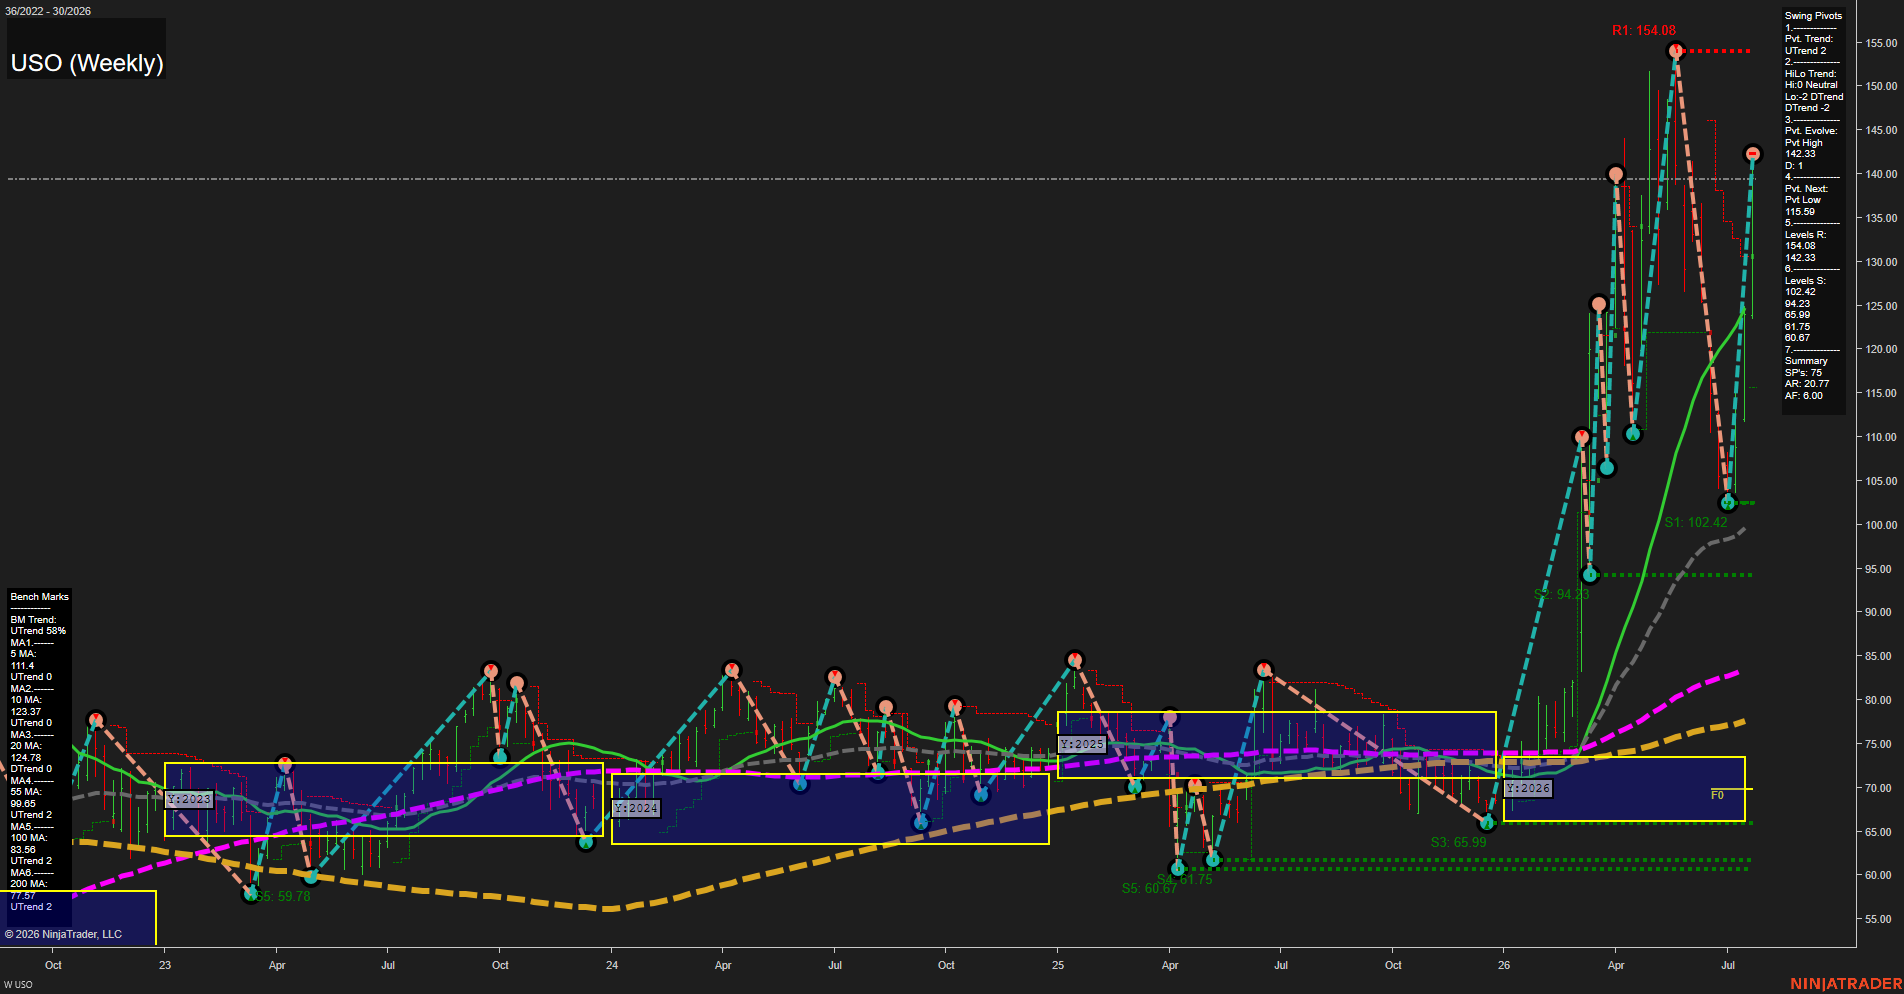
USO United States Oil Fund LP Weekly Chart Analysis: 2026-Jul-24 07:09 CT
Price Action
- Last: 142.33,
- Bars: Large,
- Mom: fast.
WSFG Weekly
- Short-Term
- WSFG Current: NA%
- F0%/NTZ' Bias: Price Bullish,
- WSFG Trend: Uptrend.
MSFG Month Jul
- Intermediate-Term
- MSFG Current: NA%
- F0%/NTZ' Bias: Price Bullish,
- MSFG Trend: Uptrend.
YSFG Year 2026
- Long-Term
- YSFG Current: NA%
- F0%/NTZ' Bias: Price Bullish,
- YSFG Trend: Uptrend.
Swing Pivots
- (Short-Term) 1. Pvt. Trend: UTrend,
- (Intermediate-Term) 2. HiLo Trend: DTrend,
- 3. Pvt. Evolve: Pvt high 142.33,
- 4. Pvt. Next: Pvt low 115.59,
- 5. Levels R: 154.08, 142.33,
- 6. Levels S: 102.42, 94.23, 65.99, 61.75, 60.67.
Weekly Benchmarks
- (Short-Term) 5 Day: 111.46 Up Trend,
- (Short-Term) 10 Day: 112.93 Up Trend,
- (Intermediate-Term) 20 Day: 124.44 Up Trend,
- (Intermediate-Term) 55 Day: 99.65 Up Trend,
- (Long-Term) 100 Day: 83.56 Up Trend,
- (Long-Term) 200 Day: 77.94 Up Trend.
Overall Rating
- Short-Term: Bullish,
- Intermediate-Term: Bullish,
- Long-Term: Bullish.
Key Insights Summary
USO displays an exceptionally strong weekly momentum expansion, with price accelerating well above every rising benchmark average and far above the 2026 yearly NTZ. The short-term pivot structure is in an UTrend, although the intermediate HiLo structure remains DTrend following the prior sharp retracement. The current advance has recovered from the 102.42 pivot-low area and is testing the 142.33 pivot-high zone; 154.08 is the next major overhead swing resistance. This is a high-volatility, news-sensitive crude-oil-style price cycle marked by wide weekly ranges, rapid V-shaped reversals, and strong directional momentum.
Chart Analysis ATS AI Generated: 2026-07-24 07:10 for Informational use only, not trading advice. Terms and Risk Disclosure Copyright © 2026. Algo Trading Systems LLC.