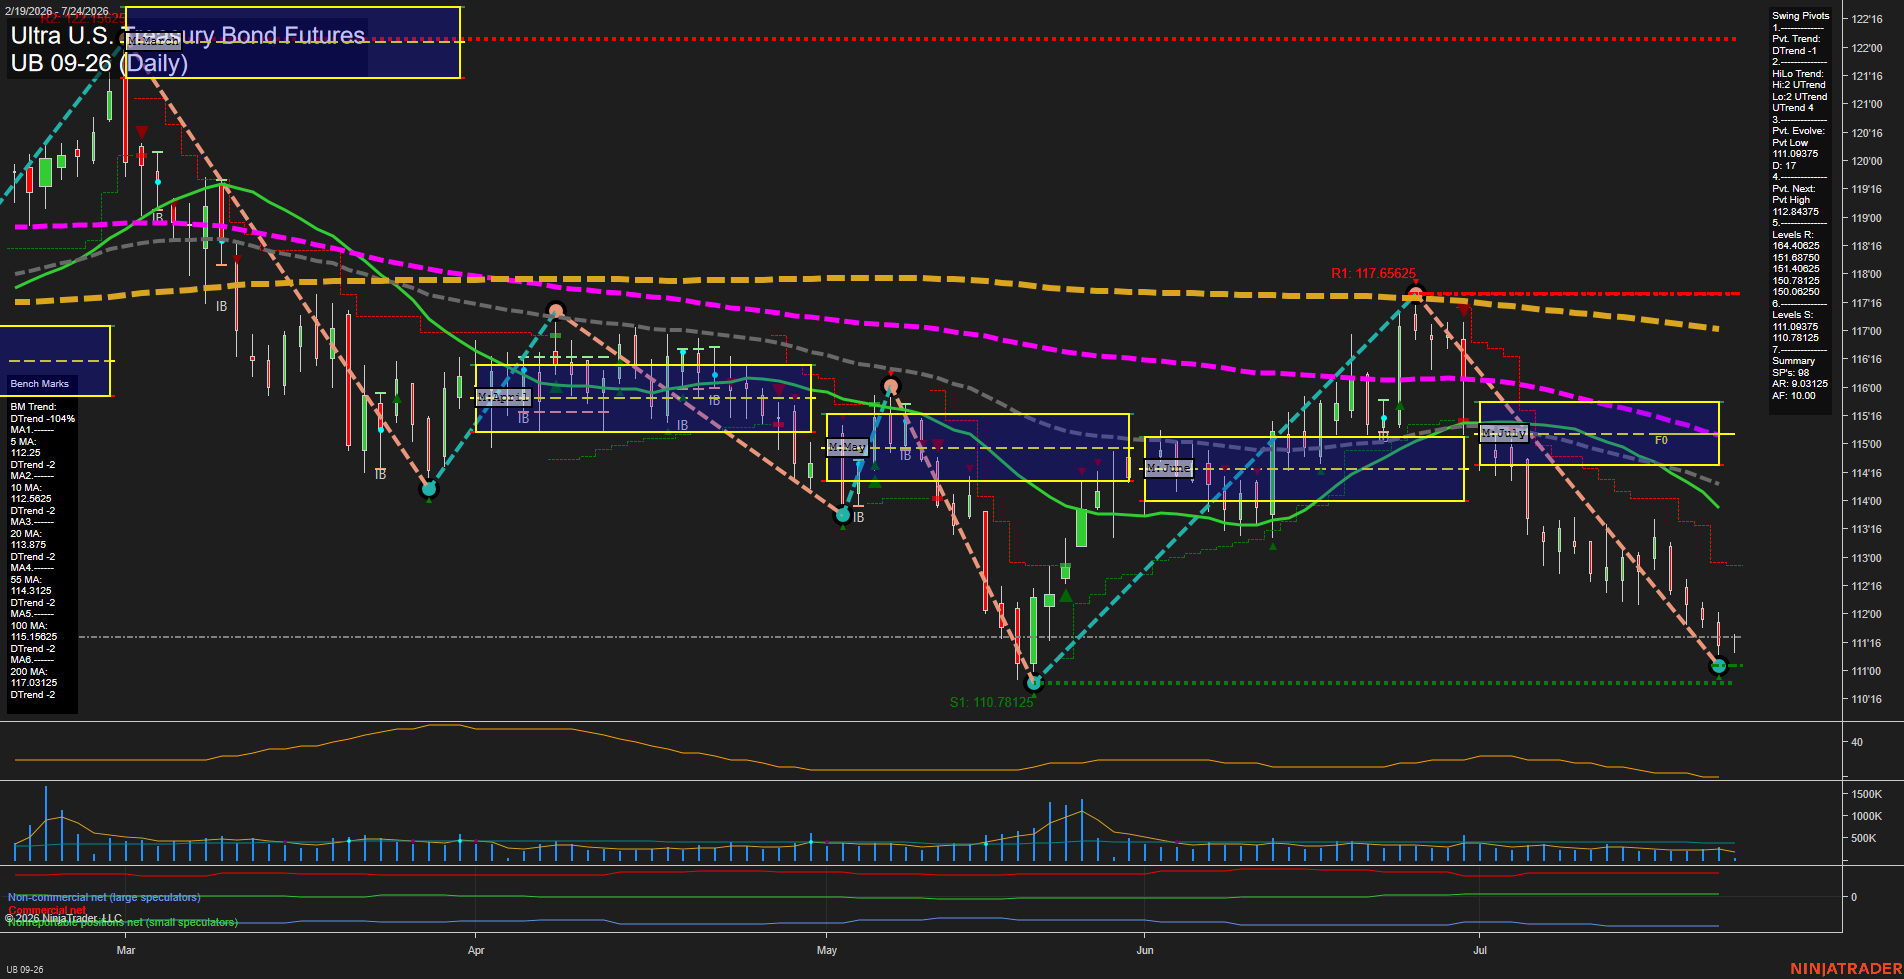
UB Ultra U.S. Treasury Bond Futures Daily Chart Analysis: 2026-Jul-24 07:09 CT
Price Action
- Last: 111.03125,
- Bars: Small,
- Mom: Slow.
WSFG Weekly
- Short-Term
- WSFG Current: -69%
- F0%/NTZ' Bias: Price Below,
- WSFG Trend: Down.
MSFG Month Jul
- Intermediate-Term
- MSFG Current: -92%
- F0%/NTZ' Bias: Price Below,
- MSFG Trend: Down.
YSFG Year 2026
- Long-Term
- YSFG Current: -16%
- F0%/NTZ' Bias: Price Below,
- YSFG Trend: Down.
Swing Pivots
- (Short-Term) 1. Pvt. Trend: DTrend,
- (Intermediate-Term) 2. HiLo Trend: UTrend,
- 3. Pvt. Evolve: Pvt low 111.9375,
- 4. Pvt. Next: Pvt high 112.84375,
- 5. Levels R: 115.78125, 115.68750, 115.40625, 114.40625,
- 6. Levels S: 111.09375, 110.78125.
Daily Benchmarks
- (Short-Term) 5 Day: 112.25 Down Trend,
- (Short-Term) 10 Day: 112.5625 Down Trend,
- (Intermediate-Term) 20 Day: 113.875 Down Trend,
- (Intermediate-Term) 55 Day: 114.3125 Down Trend,
- (Long-Term) 100 Day: 115.5625 Down Trend,
- (Long-Term) 200 Day: 117.03125 Down Trend.
Additional Metrics
Recent Trade Signals
- 20 Jul 2026: Short UB 09-26 @ 112.8125 Signals.USAR-WSFG
Overall Rating
- Short-Term: Bearish,
- Intermediate-Term: Bearish,
- Long-Term: Bearish.
Key Insights Summary
Price remains beneath the weekly and July monthly Fib zero lines and below every daily benchmark, confirming broad multi-timeframe downside alignment. The short-term pivot trend remains down, with the recent decline reaching the 110.78125 support zone; small daily bars and reduced ATR indicate that downside momentum has slowed into a compressed test of support. The intermediate HiLo structure remains technically uptrend-oriented, creating a countertrend condition beneath a declining moving-average stack. A recovery through 112.84375 would establish the next short-term pivot high, while the 114.40625 to 115.78125 resistance cluster remains the larger overhead supply area.
Chart Analysis ATS AI Generated: 2026-07-24 07:09 for Informational use only, not trading advice. Terms and Risk Disclosure Copyright © 2026. Algo Trading Systems LLC.