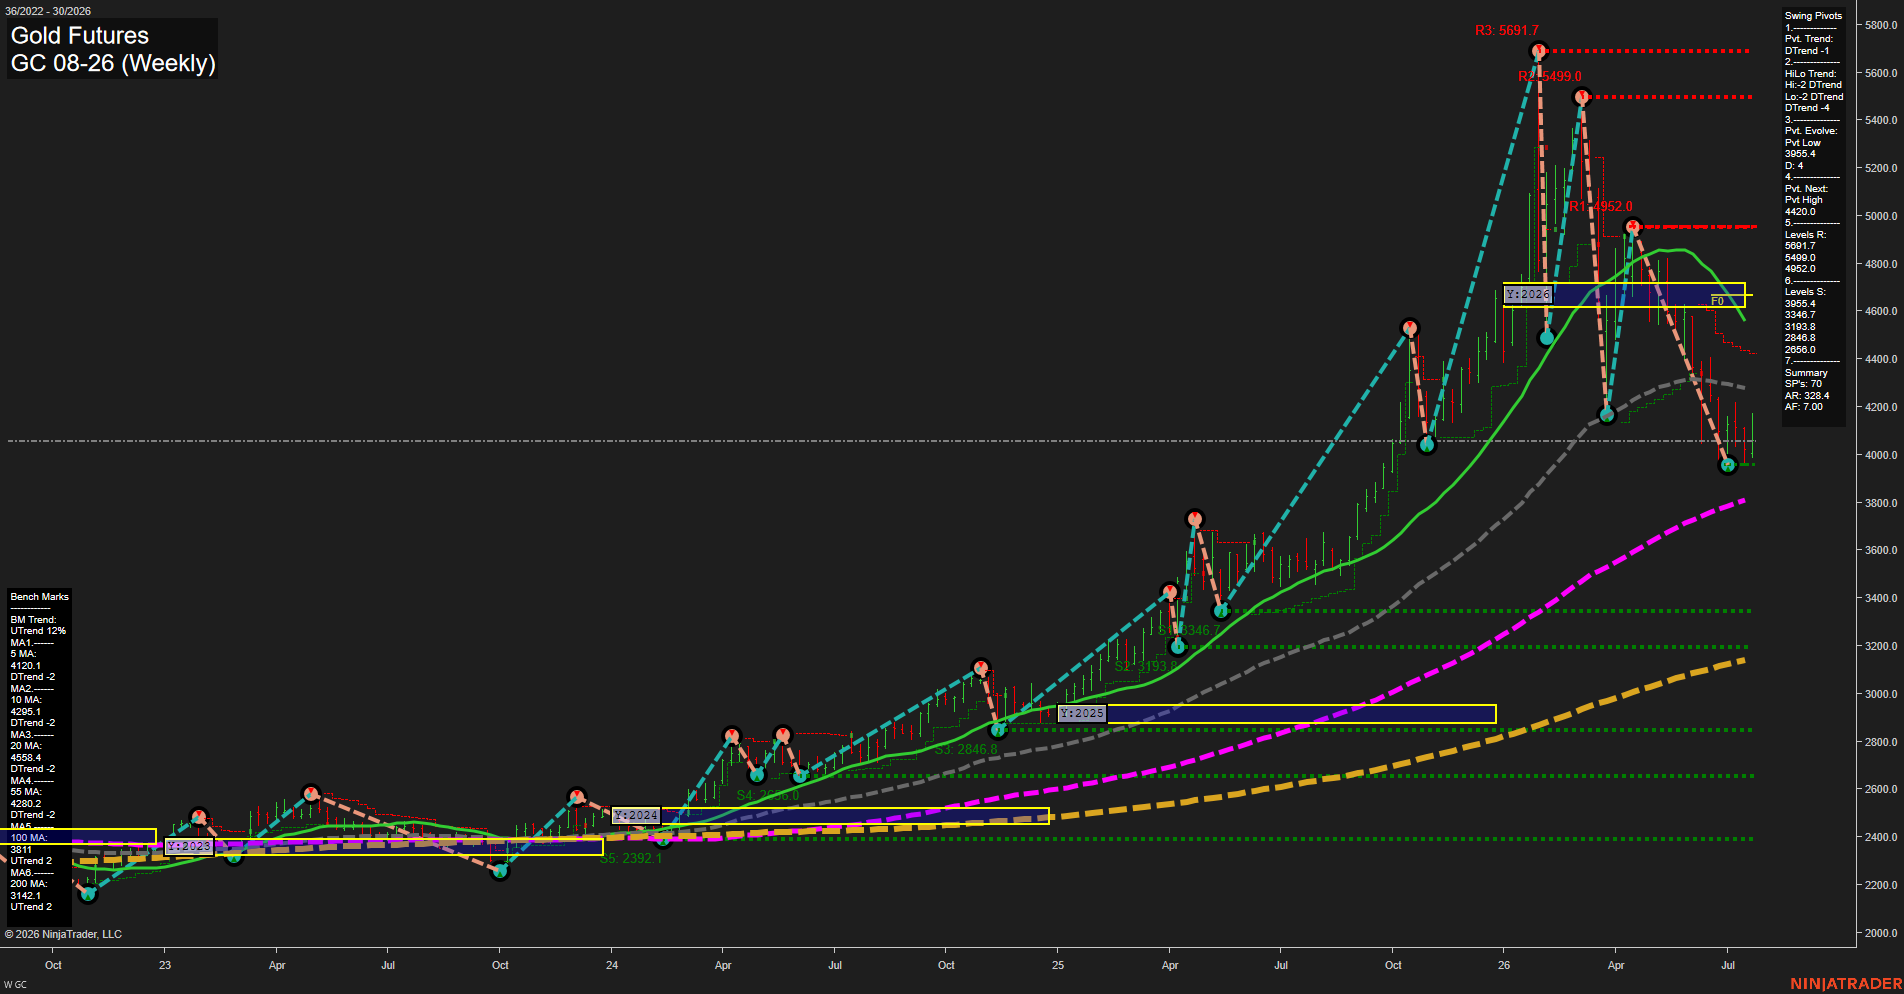
GC Gold Futures Weekly Chart Analysis: 2026-Jul-24 07:04 CT
Price Action
- Last: 4077.0,
- Bars: Medium,
- Mom: fast.
WSFG Weekly
- Short-Term
- WSFG Current: 30%
- F0%/NTZ' Bias: Price Above,
- WSFG Trend: Up.
MSFG Month Jul
- Intermediate-Term
- MSFG Current: 15%
- F0%/NTZ' Bias: Price Above,
- MSFG Trend: Up.
YSFG Year 2026
- Long-Term
- YSFG Current: -118%
- F0%/NTZ' Bias: Price Below,
- YSFG Trend: Down.
Swing Pivots
- (Short-Term) 1. Pvt. Trend: DTrend,
- (Intermediate-Term) 2. HiLo Trend: DTrend,
- 3. Pvt. Evolve: Pvt low 3955.4,
- 4. Pvt. Next: Pvt high 4420.0,
- 5. Levels R: 5691.7, 5499.0, 4952.0,
- 6. Levels S: 3955.4, 3946.7, 3193.8, 2846.8, 2756.0.
Weekly Benchmarks
- (Short-Term) 5 Day: 4120.1 Down Trend,
- (Short-Term) 10 Day: 4295.1 Down Trend,
- (Intermediate-Term) 20 Day: 4558.4 Down Trend,
- (Intermediate-Term) 55 Day: 4280.2 Down Trend,
- (Long-Term) 100 Day: 3811.4 Up Trend,
- (Long-Term) 200 Day: 3142.1 Up Trend.
Recent Trade Signals
- 23 Jul 2026: Short GC 08-26 @ 4088.4 Signals.USAR.TR120
- 21 Jul 2026: Long GC 08-26 @ 4066 Signals.USAR-MSFG
- 21 Jul 2026: Long GC 08-26 @ 4054.1 Signals.USAR-WSFG
Overall Rating
- Short-Term: Bearish,
- Intermediate-Term: Bearish,
- Long-Term: Neutral.
Key Insights Summary
Gold is in a sharp weekly corrective swing following rejection from the 4952.0 pivot resistance area. The active pivot structure remains bearish, with lower highs and lower lows, and price is below the declining 5, 10, 20, and 55-period benchmarks. The 3955.4 to 3946.7 support zone is defining the current bounce area; a recovery through 4420.0 would establish the next opposing pivot high. The broader advance remains intact above the rising 100 and 200-period benchmarks, but the yearly fib-grid position below F0% shows the long-term cycle is presently in a counter-trend downswing.
Chart Analysis ATS AI Generated: 2026-07-24 07:05 for Informational use only, not trading advice. Terms and Risk Disclosure Copyright © 2026. Algo Trading Systems LLC.