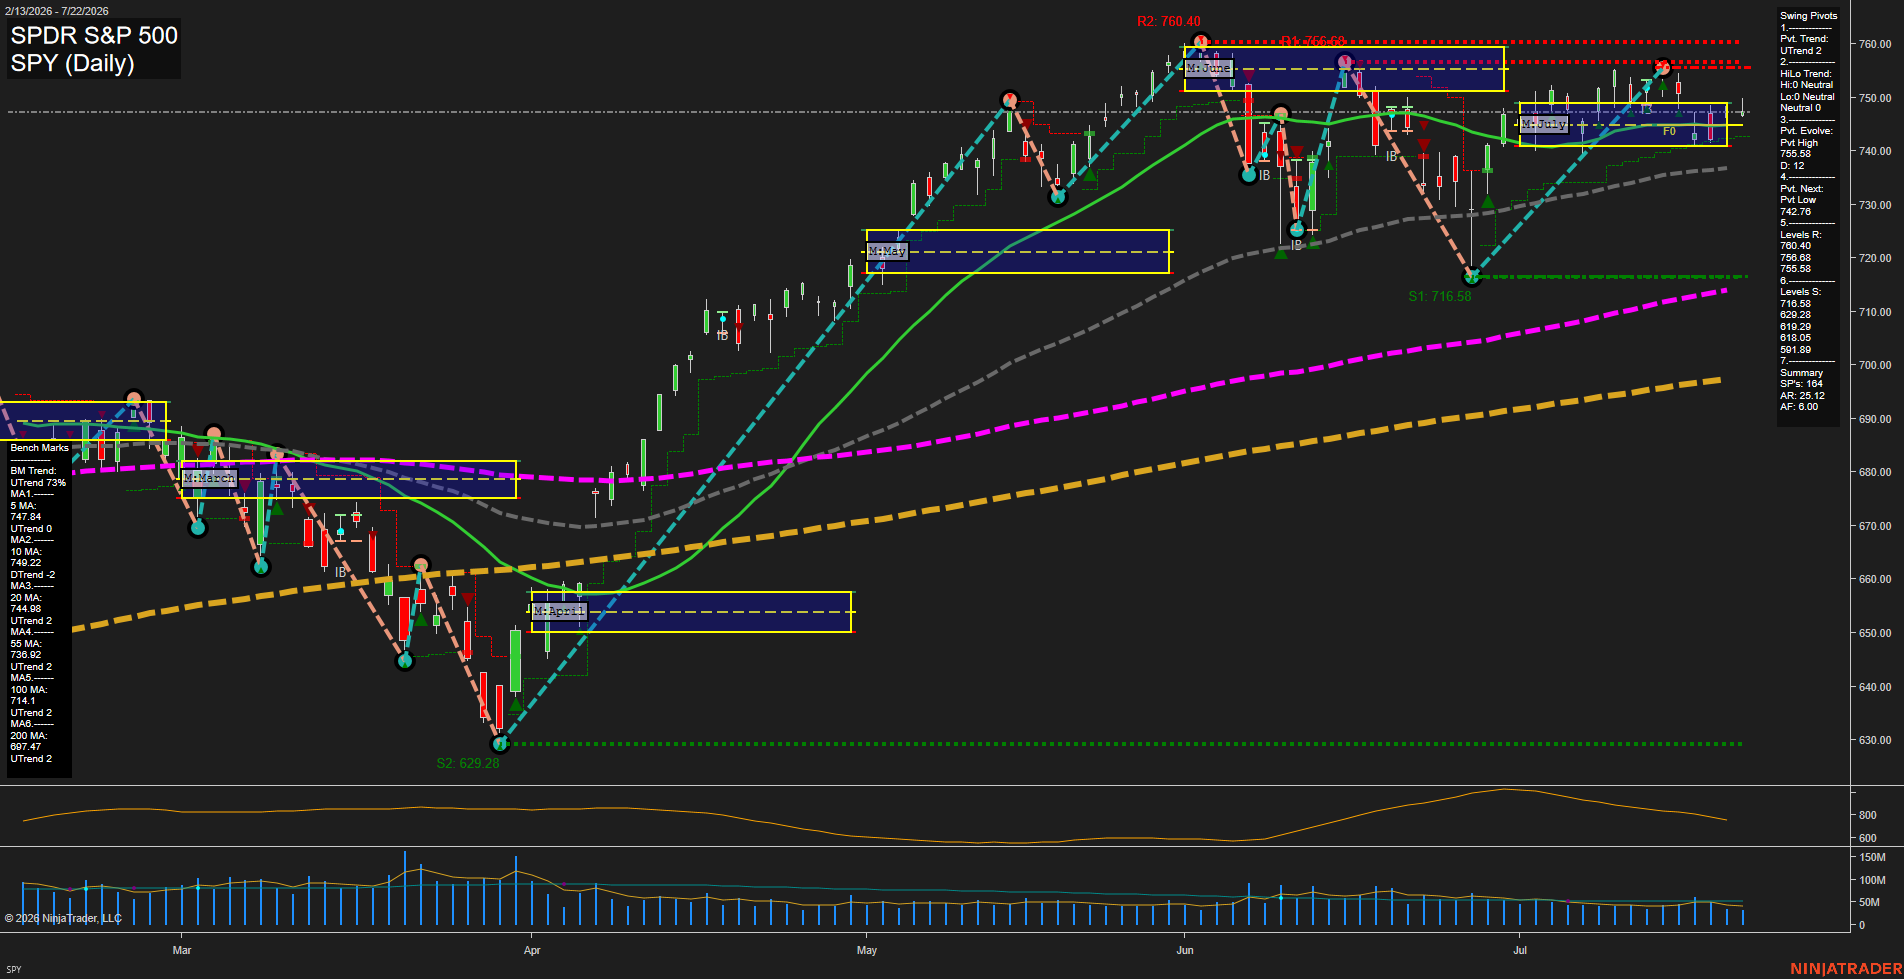
SPY SPDR S&P 500 Daily Chart Analysis: 2026-Jul-23 07:08 CT
Price Action
- Last: 748.50,
- Bars: Small,
- Mom: Average.
WSFG Weekly
- Short-Term
- WSFG Current: 73%
- F0%/NTZ' Bias: Price Bullish,
- WSFG Trend: Bullish.
MSFG Month Jul
- Intermediate-Term
- MSFG Current: 85%
- F0%/NTZ' Bias: Price Bullish,
- MSFG Trend: Bullish.
YSFG Year 2026
- Long-Term
- YSFG Current: NA%
- F0%/NTZ' Bias: Price Neutral,
- YSFG Trend: Bullish.
Swing Pivots
- (Short-Term) 1. Pvt. Trend: UTrend,
- (Intermediate-Term) 2. HiLo Trend: UTrend,
- 3. Pvt. Evolve: Pvt high 755.68,
- 4. Pvt. Next: Pvt low 742.76,
- 5. Levels R: 760.40, 756.68, 755.58,
- 6. Levels S: 716.58, 692.28, 619.29, 618.05, 592.89.
Daily Benchmarks
- (Short-Term) 5 Day: 747.84 Up Trend,
- (Short-Term) 10 Day: 749.22 Down Trend,
- (Intermediate-Term) 20 Day: 744.48 Up Trend,
- (Intermediate-Term) 55 Day: 736.92 Up Trend,
- (Long-Term) 100 Day: 714.44 Up Trend,
- (Long-Term) 200 Day: 677.47 Up Trend.
Additional Metrics
- ATR: 25.12,
- VOLMA: 6000000.
Overall Rating
- Short-Term: Bullish,
- Intermediate-Term: Bullish,
- Long-Term: Bullish.
Key Insights Summary
SPY, viewed as an ES futures swing proxy, remains in a broad bullish structure: price is above the rising 20-, 55-, 100-, and 200-day benchmarks, while the short-term pivot trend remains upward. The latest action is a relatively tight consolidation around the July MSFG upper area and near the 5-day average, with the 10-day average marginally overhead. This reflects a mature advance with slower momentum rather than a decisive directional expansion. The 755.58-760.40 pivot-resistance band defines the recent high-side ceiling, while 742.76 and the rising 20-day average near 744.48 frame the nearby swing support zone. Volume has contracted from the June activity surge and ATR has eased, consistent with a choppier compression phase inside the larger uptrend.
Chart Analysis ATS AI Generated: 2026-07-23 07:08 for Informational use only, not trading advice. Terms and Risk Disclosure Copyright © 2026. Algo Trading Systems LLC.