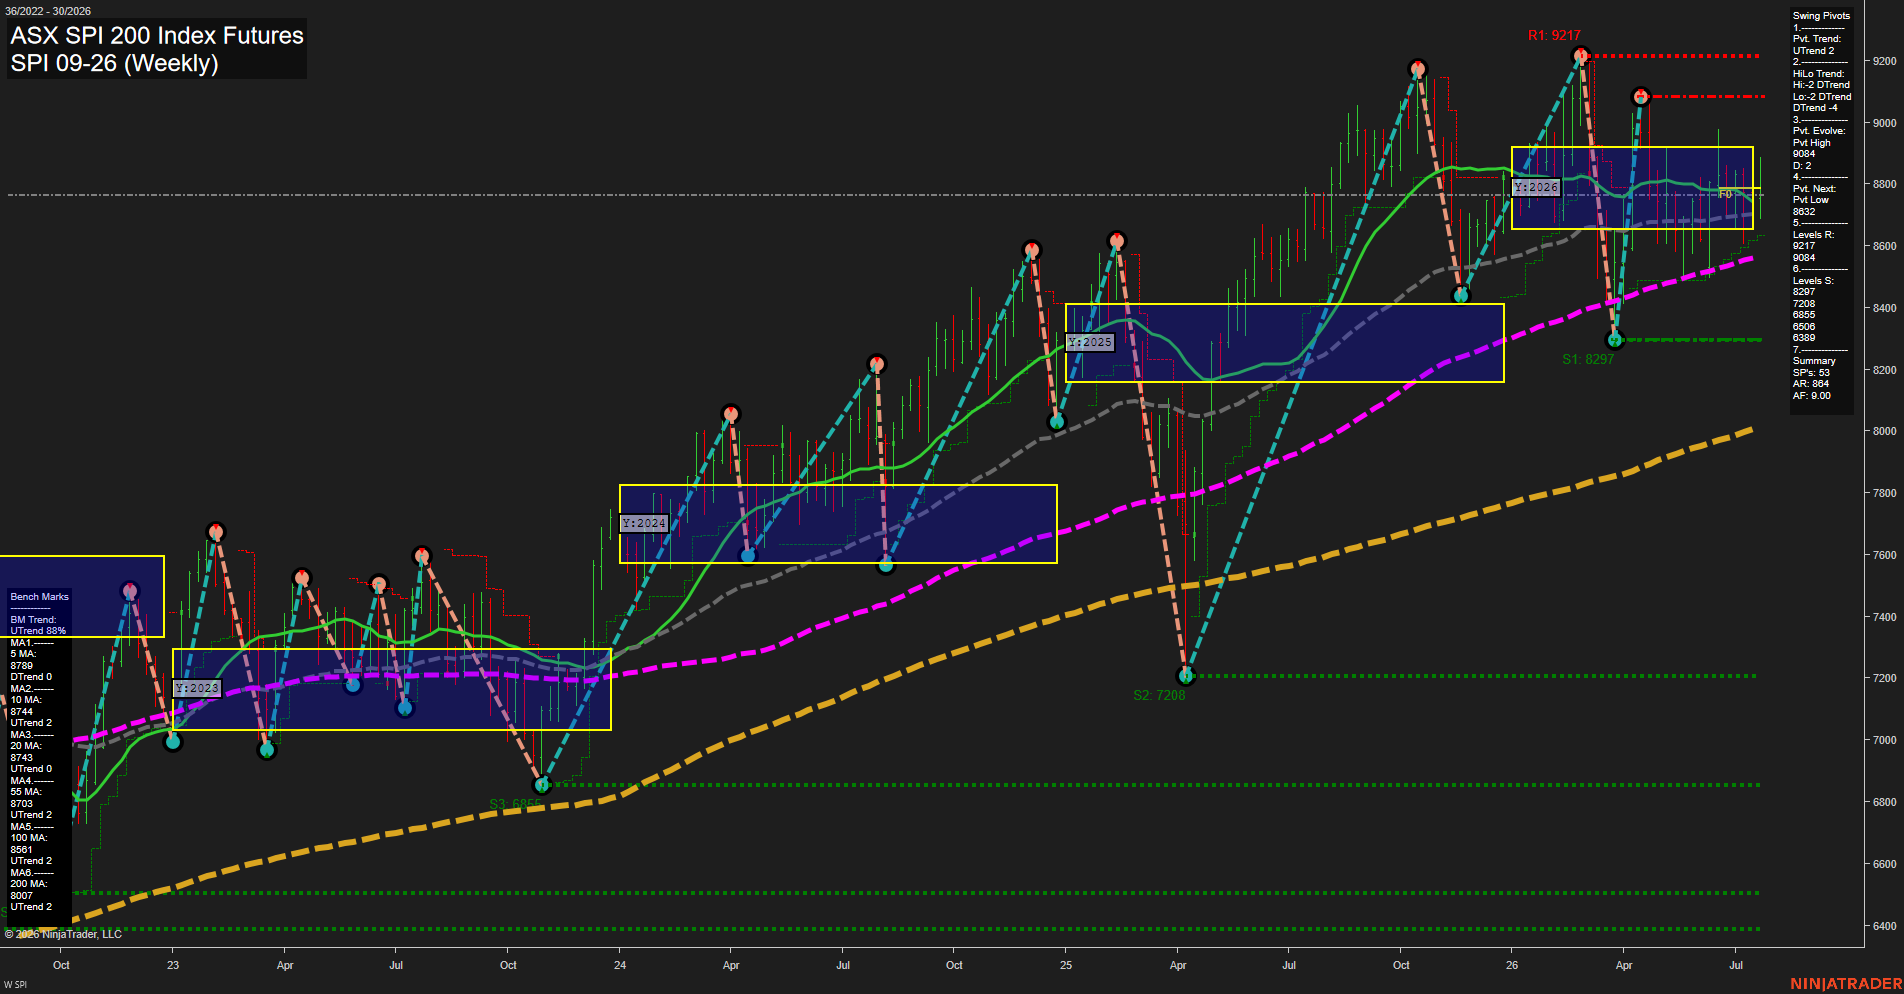
SPI ASX SPI 200 Index Futures Weekly Chart Analysis: 2026-Jul-23 07:08 CT
Price Action
- Last: 8778,
- Bars: Medium,
- Mom: average.
WSFG Weekly
- Short-Term
- WSFG Current: NA%
- F0%/NTZ' Bias: Price Neutral,
- WSFG Trend: Neutral.
MSFG Month Jul
- Intermediate-Term
- MSFG Current: NA%
- F0%/NTZ' Bias: Price Neutral,
- MSFG Trend: Neutral.
YSFG Year 2026
- Long-Term
- YSFG Current: NA%
- F0%/NTZ' Bias: Price Neutral,
- YSFG Trend: Neutral.
Swing Pivots
- (Short-Term) 1. Pvt. Trend: UTrend,
- (Intermediate-Term) 2. HiLo Trend: DTrend,
- 3. Pvt. Evolve: Pvt high 9084,
- 4. Pvt. Next: Pvt low 8632,
- 5. Levels R: 9217, 9084,
- 6. Levels S: 8297, 7208, 6855, 6506, 6389.
Weekly Benchmarks
- (Short-Term) 5 Day: 8789 Down Trend,
- (Short-Term) 10 Day: 8744 Up Trend,
- (Intermediate-Term) 20 Day: 8743 Up Trend,
- (Intermediate-Term) 55 Day: 8703 Up Trend,
- (Long-Term) 100 Day: 8561 Up Trend,
- (Long-Term) 200 Day: 6807 Up Trend.
Overall Rating
- Short-Term: Neutral,
- Intermediate-Term: Neutral,
- Long-Term: Bullish.
Key Insights Summary
SPI is consolidating near the yearly F0% area inside the 2026 neutral zone, with medium weekly bars and average momentum reflecting two-sided rotational trade. The short-term pivot structure remains upward, although the latest evolving pivot is the 9084 high and the 5-period benchmark has turned lower. Price remains above the rising 10, 20, 55, 100, and 200 benchmarks, preserving the broader bullish structure. The 9084 and 9217 swing highs frame overhead resistance, while 8632 is the near-term pivot reversal level and 8297 is the major lower support reference. The intermediate pivot sequence remains classified as a downtrend, indicating the current recovery is still working through a broad consolidation beneath prior highs.
Chart Analysis ATS AI Generated: 2026-07-23 07:08 for Informational use only, not trading advice. Terms and Risk Disclosure Copyright © 2026. Algo Trading Systems LLC.