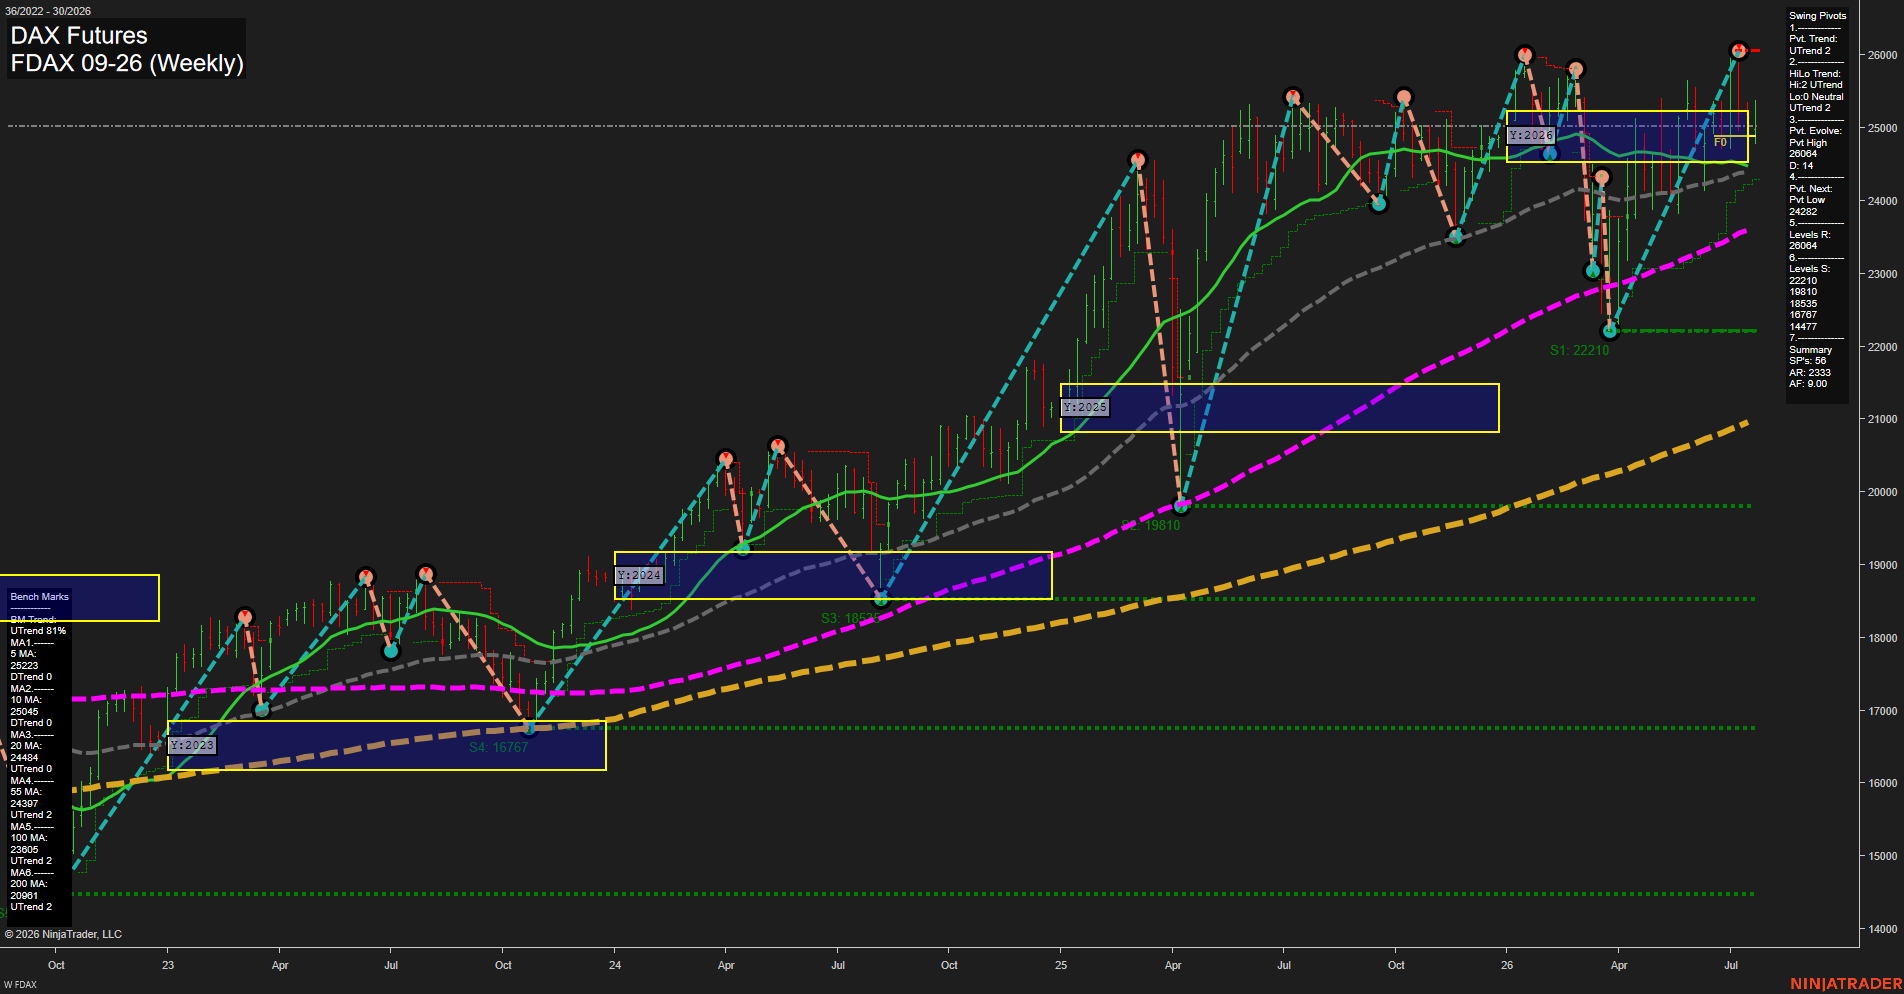
FDAX DAX Futures Weekly Chart Analysis: 2026-Jul-23 07:04 CT
Price Action
- Last: 25458,
- Bars: Medium,
- Mom: fast.
WSFG Weekly
- Short-Term
- WSFG Current: 13%
- F0%/NTZ' Bias: Price Above,
- WSFG Trend: Up.
MSFG Month Jul
- Intermediate-Term
- MSFG Current: -2%
- F0%/NTZ' Bias: Price Below,
- MSFG Trend: Down.
YSFG Year 2026
- Long-Term
- YSFG Current: 6%
- F0%/NTZ' Bias: Price Above,
- YSFG Trend: Up.
Swing Pivots
- (Short-Term) 1. Pvt. Trend: UTrend,
- (Intermediate-Term) 2. HiLo Trend: UTrend,
- 3. Pvt. Evolve: Pvt high 26064,
- 4. Pvt. Next: Pvt low 24282,
- 5. Levels R: 26064,
- 6. Levels S: 22210, 19810, 18355, 17677, 14777.
Weekly Benchmarks
- (Short-Term) 5 Day: 25222 Up Trend,
- (Short-Term) 10 Day: 25045 Up Trend,
- (Intermediate-Term) 20 Day: 24483 Up Trend,
- (Intermediate-Term) 55 Day: 24397 Up Trend,
- (Long-Term) 100 Day: 23605 Up Trend,
- (Long-Term) 200 Day: 20888 Up Trend.
Recent Trade Signals
- 22 Jul 2026: Long FDAX 09-26 @ 25299 Signals.USAR-MSFG
- 22 Jul 2026: Long FDAX 09-26 @ 25164 Signals.USAR-WSFG
Overall Rating
- Short-Term: Bullish,
- Intermediate-Term: Bullish,
- Long-Term: Bullish.
Key Insights Summary
Price action has resumed a higher-high sequence following the sharp April recovery, with weekly momentum firm and price holding above every benchmark average. The weekly and yearly Fib grids remain constructive, while the July monthly grid remains marginally below its F0% level and reflects an intermediate countertrend consolidation. Pivot structure remains upward, with 26064 defining the active swing-high resistance and 24282 the pivotal reversal level for a new downswing. The market is pressing the upper portion of the yearly range after a fast advance, indicating a strong but increasingly extended rally phase.
Chart Analysis ATS AI Generated: 2026-07-23 07:04 for Informational use only, not trading advice. Terms and Risk Disclosure Copyright © 2026. Algo Trading Systems LLC.