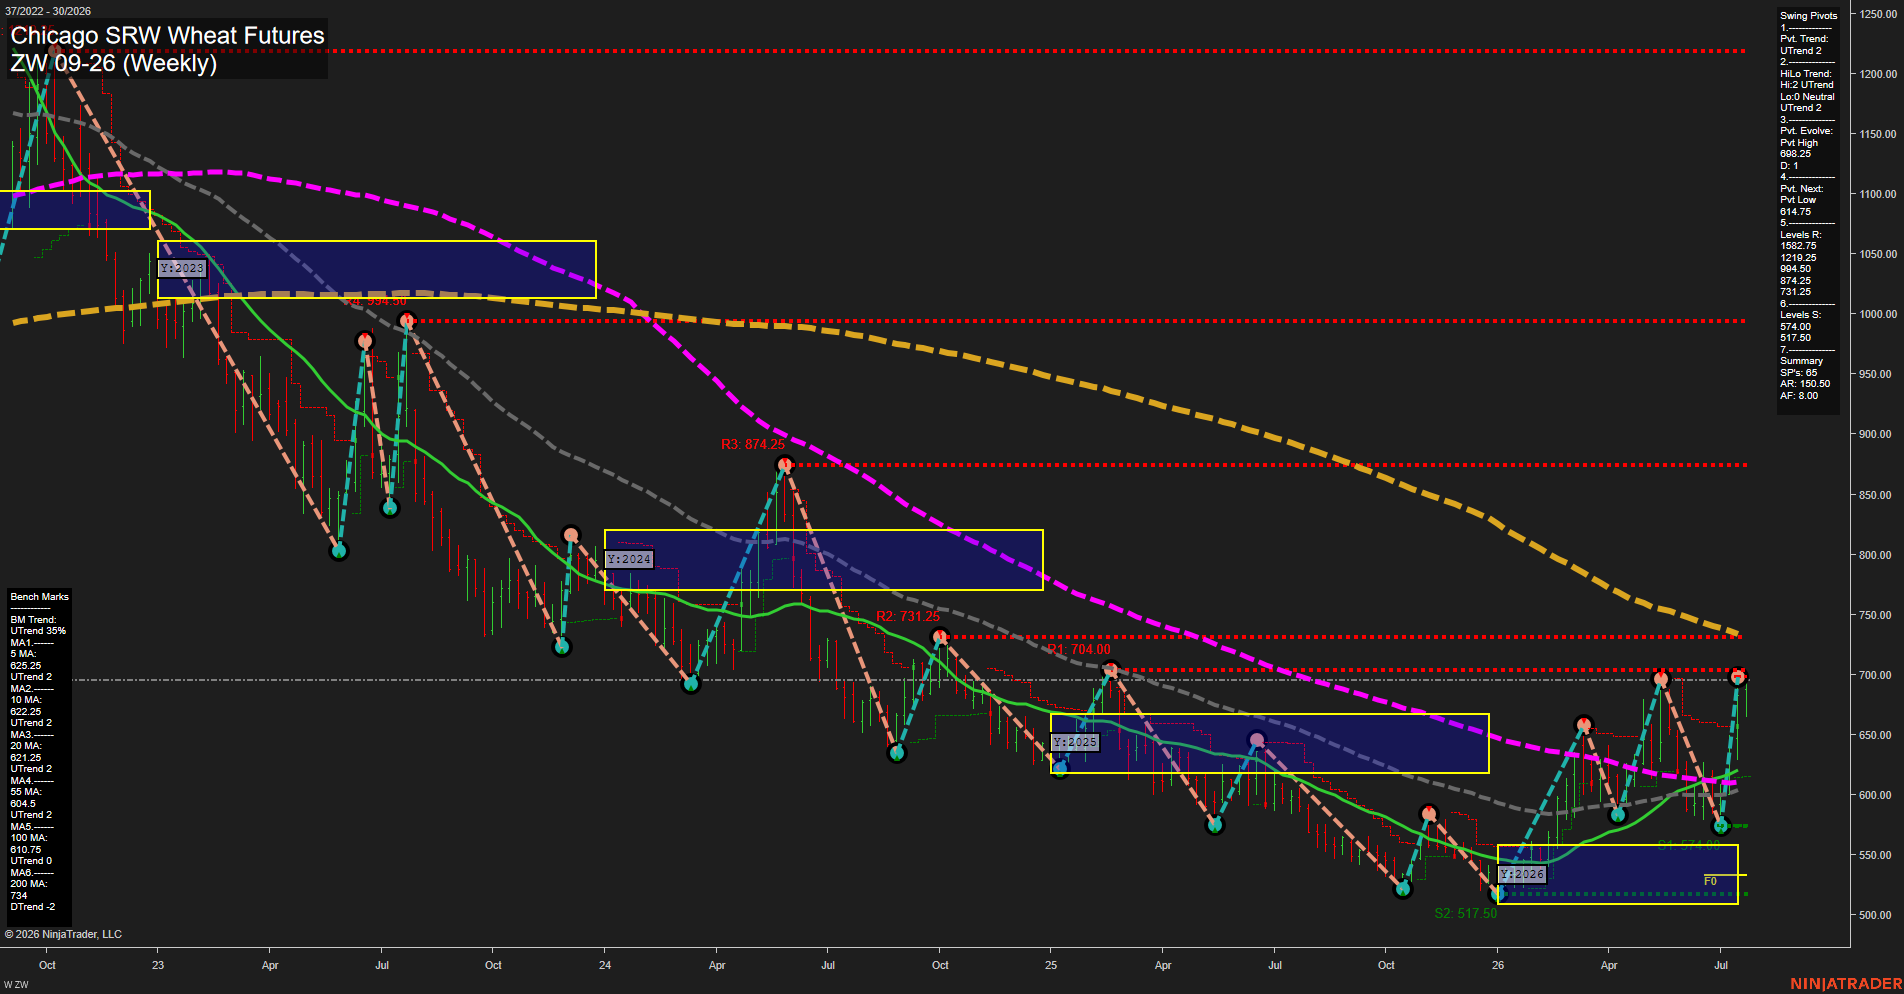
ZW Chicago SRW Wheat Futures Weekly Chart Analysis: 2026-Jul-22 07:11 CT
Price Action
- Last: 698.25,
- Bars: Large,
- Mom: fast.
WSFG Weekly
- Short-Term
- WSFG Current: 19%
- F0%/NTZ' Bias: Price Above,
- WSFG Trend: Up.
MSFG Month Jul
- Intermediate-Term
- MSFG Current: 140%
- F0%/NTZ' Bias: Price Above,
- MSFG Trend: Up.
YSFG Year 2026
- Long-Term
- YSFG Current: 67%
- F0%/NTZ' Bias: Price Above,
- YSFG Trend: Up.
Swing Pivots
- (Short-Term) 1. Pvt. Trend: UTrend,
- (Intermediate-Term) 2. HiLo Trend: UTrend,
- 3. Pvt. Evolve: Pvt high 698.25,
- 4. Pvt. Next: Pvt low 614.75,
- 5. Levels R: 1582.75, 1219.25, 994.50, 874.25, 731.25,
- 6. Levels S: 574.00, 517.50.
Weekly Benchmarks
- (Short-Term) 5 Day: 625.25 Up Trend,
- (Short-Term) 10 Day: 622.25 Up Trend,
- (Intermediate-Term) 20 Day: 621.25 Up Trend,
- (Intermediate-Term) 55 Day: 604.50 Up Trend,
- (Long-Term) 100 Day: 610.75 Up Trend,
- (Long-Term) 200 Day: 734.00 Down Trend.
Overall Rating
- Short-Term: Bullish,
- Intermediate-Term: Bullish,
- Long-Term: Bullish.
Key Insights Summary
Price action has produced a fast, large-range recovery from the 574.00 support area and has reached 698.25, confirming an advancing short-term pivot sequence. Price is above the rising 5, 10, 20, 55, and 100-week benchmarks, while the weekly, monthly, and yearly Fib-grid readings remain above their F0% levels. The 731.25 pivot resistance is the nearest overhead structural level, with 614.75 defining the opposite-pivot threshold. The broader recovery remains below the declining 200-week benchmark at 734.00, leaving the market in a strong intermediate recovery within a still-unresolved major-trend resistance zone.
Chart Analysis ATS AI Generated: 2026-07-22 07:11 for Informational use only, not trading advice. Terms and Risk Disclosure Copyright © 2026. Algo Trading Systems LLC.