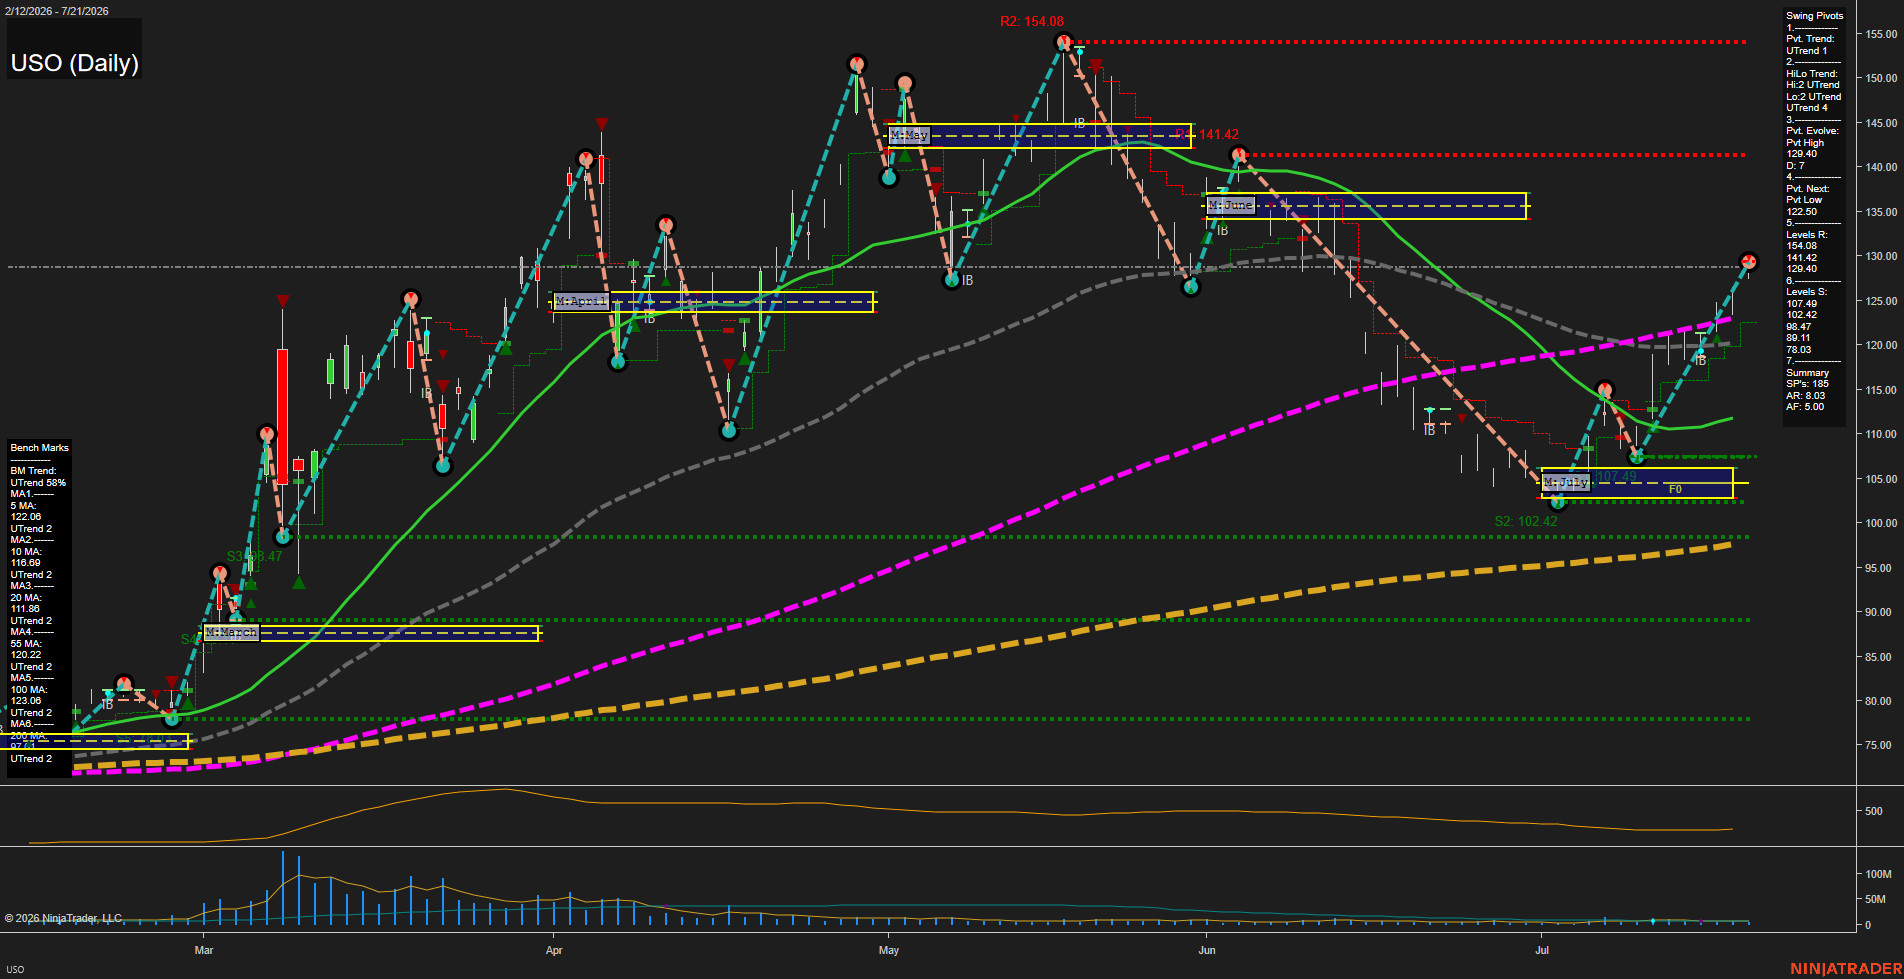
USO United States Oil Fund LP Daily Chart Analysis: 2026-Jul-22 07:09 CT
Price Action
- Last: 129.40,
- Bars: Large,
- Mom: Fast.
WSFG Weekly
- Short-Term
- WSFG Current: NA%
- F0%/NTZ' Bias: Price Neutral,
- WSFG Trend: Neutral.
MSFG Month Jul
- Intermediate-Term
- MSFG Current: NA%
- F0%/NTZ' Bias: Price Above NTZ,
- MSFG Trend: Bullish.
YSFG Year 2026
- Long-Term
- YSFG Current: NA%
- F0%/NTZ' Bias: Price Neutral,
- YSFG Trend: Neutral.
Swing Pivots
- (Short-Term) 1. Pvt. Trend: UTrend,
- (Intermediate-Term) 2. HiLo Trend: UTrend,
- 3. Pvt. Evolve: Pvt high 129.40,
- 4. Pvt. Next: Pvt low 122.50,
- 5. Levels R: 154.08, 141.42, 129.40,
- 6. Levels S: 107.49, 102.42, 98.47, 89.11, 78.03.
Daily Benchmarks
- (Short-Term) 5 Day: 122.06 Up Trend,
- (Short-Term) 10 Day: 116.69 Up Trend,
- (Intermediate-Term) 20 Day: 111.88 Up Trend,
- (Intermediate-Term) 55 Day: 120.22 Down Trend,
- (Long-Term) 100 Day: 123.06 Up Trend,
- (Long-Term) 200 Day: 77.00 Up Trend.
Additional Metrics
- ATR: 8.03,
- VOLMA: 2577640.
Overall Rating
- Short-Term: Bullish,
- Intermediate-Term: Bullish,
- Long-Term: Bullish.
Key Insights Summary
USO has completed a sharp V-style recovery from the July 102.42 pivot-support area and is now printing a new short-term pivot high at 129.40. Price is above the 5-, 10-, 20-, and 100-day benchmarks, while the rising pivot structure confirms higher lows and higher highs. The 55-day average remains in a down trend near 120.22, making the 122.50 pivot-next level and 120.22 area the principal intermediate retracement reference. The advance has pushed materially above July’s monthly NTZ, reflecting strong upside expansion, while 141.42 and 154.08 define the next overhead swing-resistance zones. ATR at 8.03 indicates an expanded daily swing range relative to the recent consolidation.
Chart Analysis ATS AI Generated: 2026-07-22 07:09 for Informational use only, not trading advice. Terms and Risk Disclosure Copyright © 2026. Algo Trading Systems LLC.