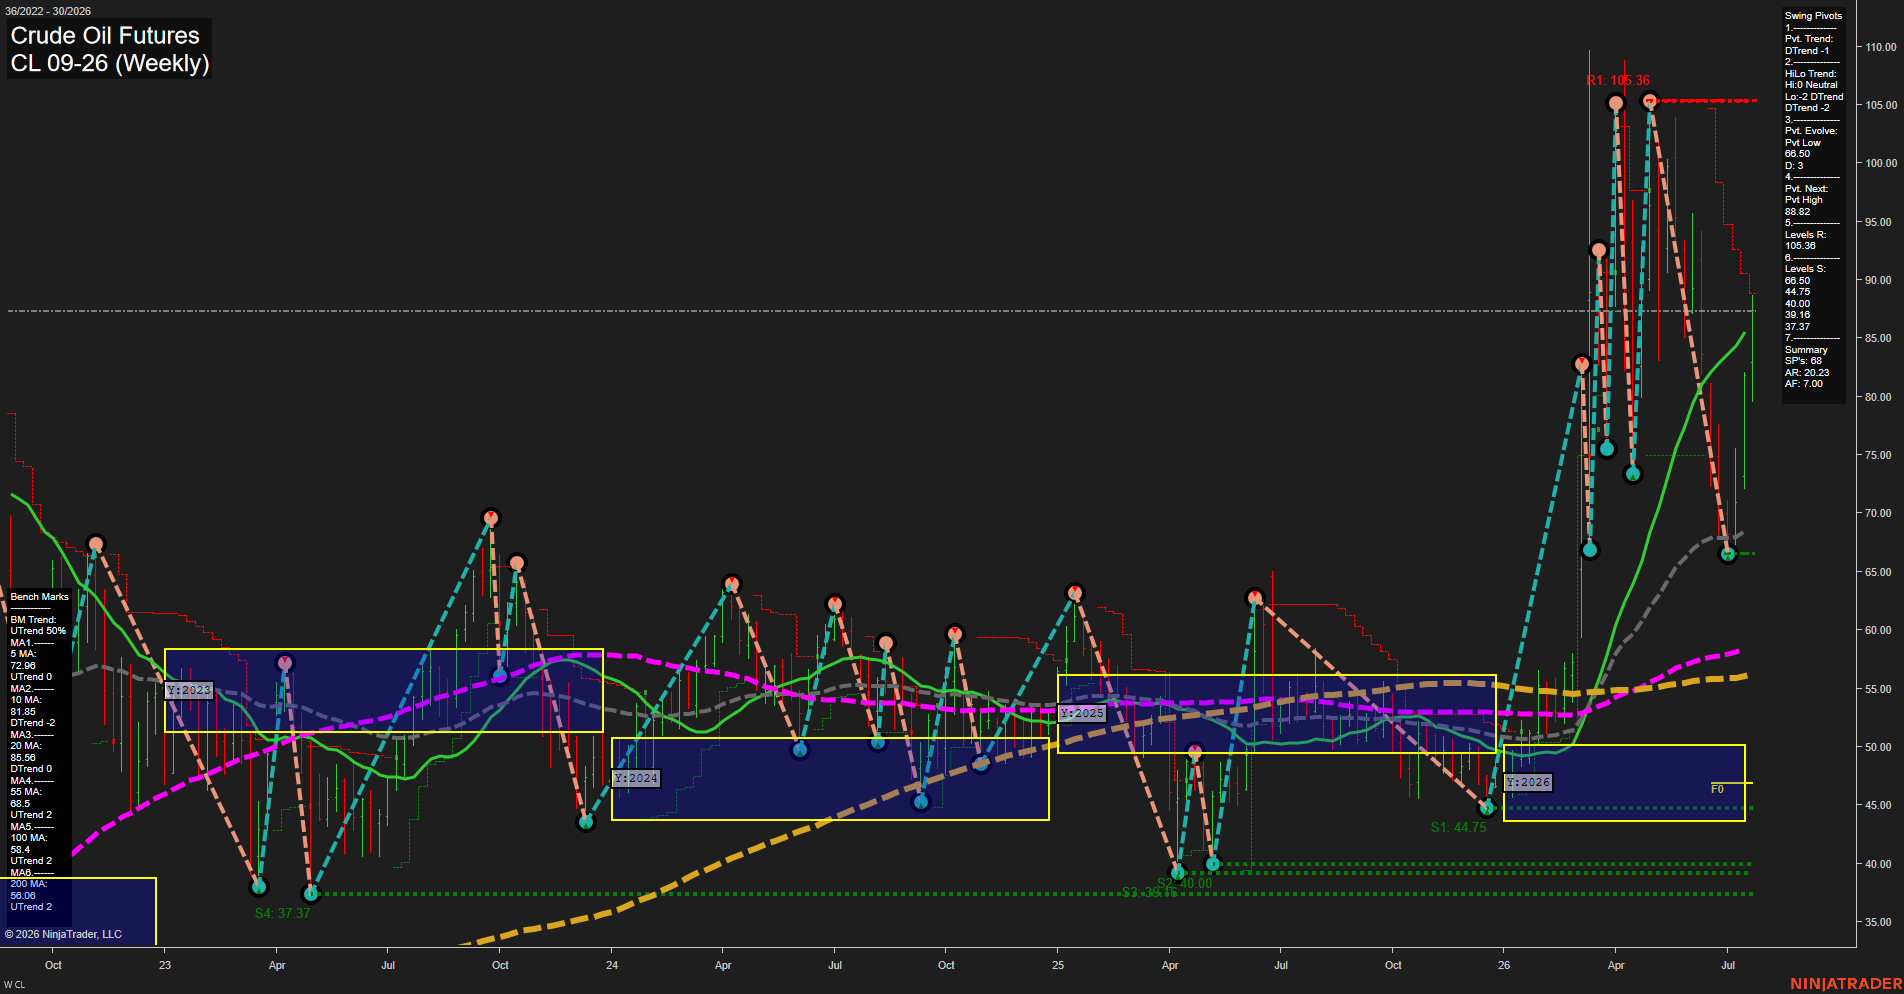
CL Crude Oil Futures Weekly Chart Analysis: 2026-Jul-22 07:02 CT
Price Action
- Last: 88.82,
- Bars: Large,
- Mom: fast.
WSFG Weekly
- Short-Term
- WSFG Current: 58%
- F0%/NTZ' Bias: Price Above,
- WSFG Trend: Up.
MSFG Month Jul
- Intermediate-Term
- MSFG Current: 69%
- F0%/NTZ' Bias: Price Above,
- MSFG Trend: Up.
YSFG Year 2026
- Long-Term
- YSFG Current: 124%
- F0%/NTZ' Bias: Price Above,
- YSFG Trend: Up.
Swing Pivots
- (Short-Term) 1. Pvt. Trend: DTrend,
- (Intermediate-Term) 2. HiLo Trend: HiLo Neutral,
- 3. Pvt. Evolve: Pvt low 66.50,
- 4. Pvt. Next: Pvt high 88.82,
- 5. Levels R: 105.36,
- 6. Levels S: 66.50, 44.75, 40.00, 39.16, 37.37.
Weekly Benchmarks
- (Short-Term) 5 Day: 72.96 Up Trend,
- (Short-Term) 10 Day: 81.85 Down Trend,
- (Intermediate-Term) 20 Day: 85.56 Down Trend,
- (Intermediate-Term) 55 Day: 68.50 Up Trend,
- (Long-Term) 100 Day: 58.40 Up Trend,
- (Long-Term) 200 Day: 58.06 Up Trend.
Recent Trade Signals
- 21 Jul 2026: Long CL 09-26 @ 84.52 Signals.USAR-WSFG
Overall Rating
- Short-Term: Bullish,
- Intermediate-Term: Bullish,
- Long-Term: Bullish.
Key Insights Summary
CL has produced a high-volatility upside recovery from the 66.50 pivot low, with the latest large weekly range lifting price above the 20, 55, 100, and 200 period benchmarks. The broader fib structure remains upward across weekly, monthly, and yearly measures, while the short-term pivot reading remains DTrend following the prior decline from the 105.36 high. Price is testing the 88.82 pivot-reversal area; a sustained move through this zone would formalize the next pivot high, while 81.85, 72.96, 68.50, and 66.50 define the layered pullback structure beneath the advance.
Chart Analysis ATS AI Generated: 2026-07-22 07:02 for Informational use only, not trading advice. Terms and Risk Disclosure Copyright © 2026. Algo Trading Systems LLC.