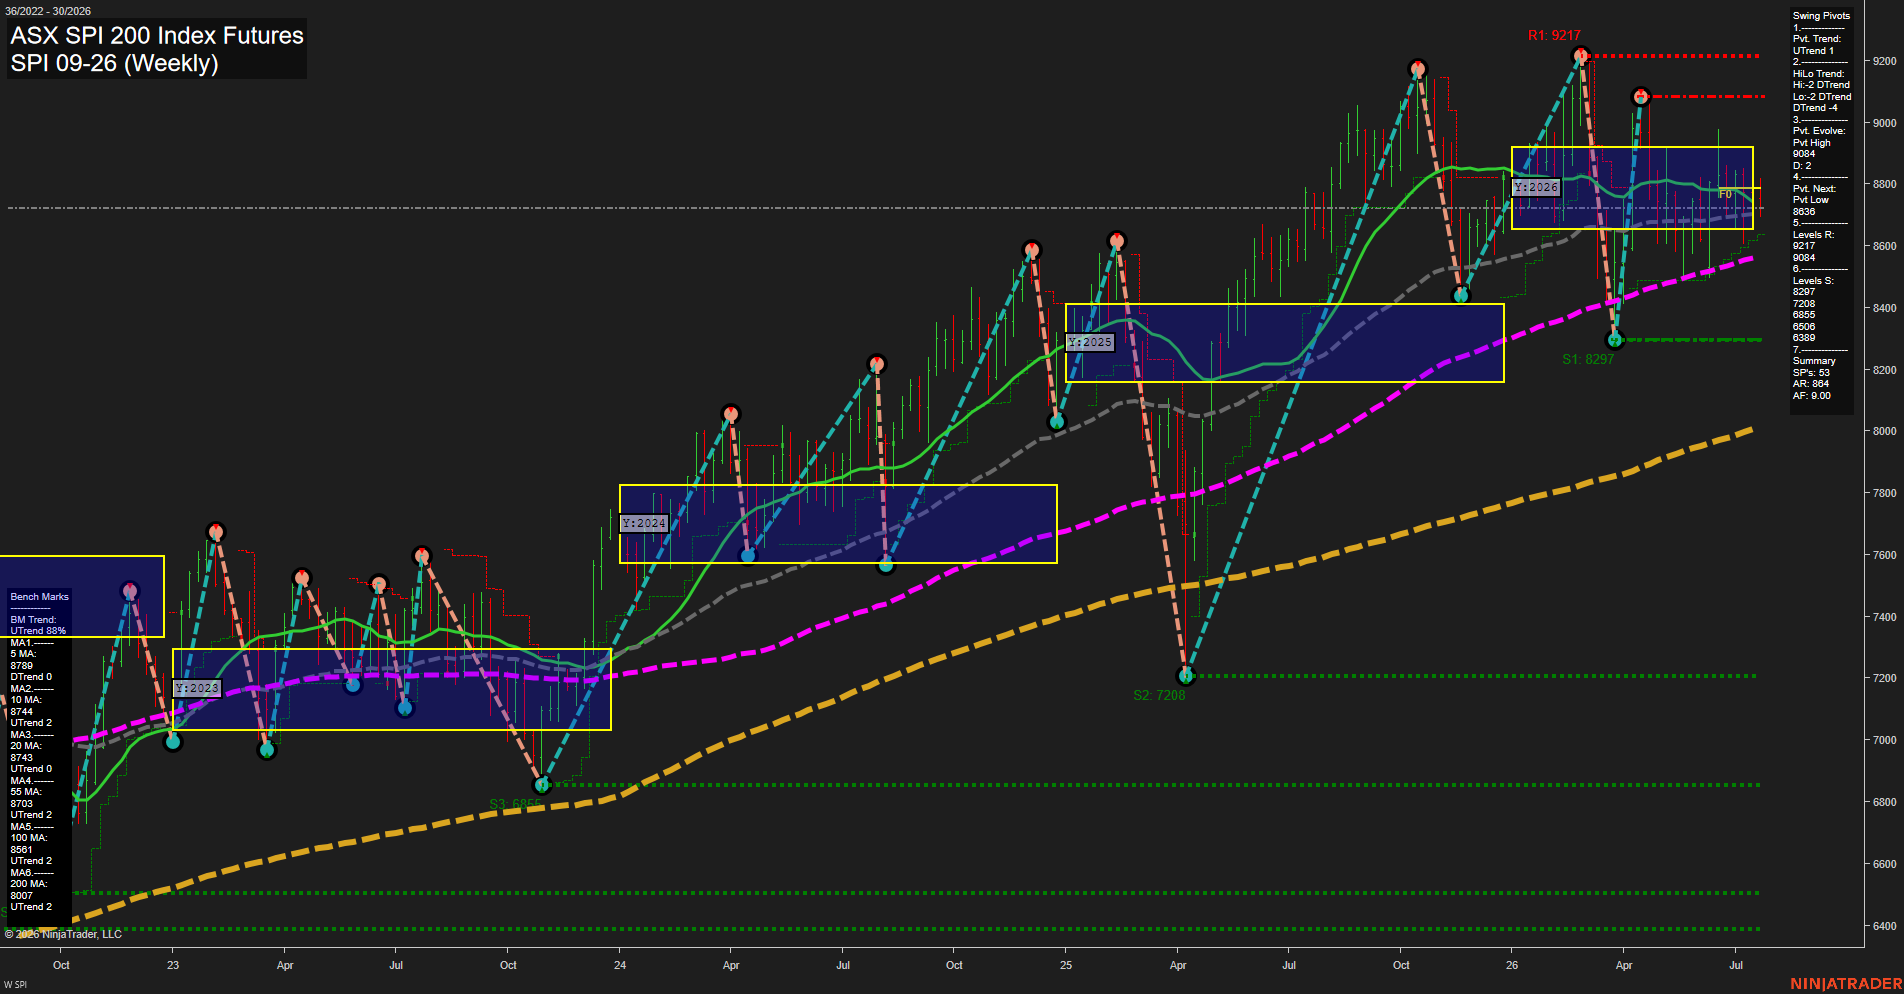
SPI ASX SPI 200 Index Futures Weekly Chart Analysis: 2026-Jul-21 07:07 CT
Price Action
- Last: 8742,
- Bars: Medium,
- Mom: slow.
WSFG Weekly
- Short-Term
- WSFG Current: NA%
- F0%/NTZ' Bias: Price Neutral,
- WSFG Trend: Neutral.
MSFG Month Jul
- Intermediate-Term
- MSFG Current: NA%
- F0%/NTZ' Bias: Price Neutral,
- MSFG Trend: Neutral.
YSFG Year 2026
- Long-Term
- YSFG Current: NA%
- F0%/NTZ' Bias: Price Bearish,
- YSFG Trend: Neutral.
Swing Pivots
- (Short-Term) 1. Pvt. Trend: UTrend,
- (Intermediate-Term) 2. HiLo Trend: DTrend,
- 3. Pvt. Evolve: Pvt high 9084,
- 4. Pvt. Next: Pvt low 8636,
- 5. Levels R: 9217, 9084,
- 6. Levels S: 8297, 7208, 6855, 6506, 6389.
Weekly Benchmarks
- (Short-Term) 5 Day: 8789 Down Trend,
- (Short-Term) 10 Day: 8744 Up Trend,
- (Intermediate-Term) 20 Day: 8743 Up Trend,
- (Intermediate-Term) 55 Day: 8703 Up Trend,
- (Long-Term) 100 Day: 8561 Up Trend,
- (Long-Term) 200 Day: 8007 Up Trend.
Overall Rating
- Short-Term: Bullish,
- Intermediate-Term: Neutral,
- Long-Term: Bullish.
Key Insights Summary
Price is consolidating near 8742 after rejecting the 9084 pivot high, with medium weekly bars and slow momentum reflecting a choppy range rather than impulsive continuation. The short-term pivot structure remains upward and price is holding above the rising 55, 100, and 200-period benchmarks, while the intermediate HiLo structure remains downward following the decline from the 9217 high. The 2026 yearly grid places price in the lower portion of its neutral zone and beneath its F0% area, framing 8789 to 9084 as overhead technical pressure and 8703 to 8636 as the nearby support region.
Chart Analysis ATS AI Generated: 2026-07-21 07:08 for Informational use only, not trading advice. Terms and Risk Disclosure Copyright © 2026. Algo Trading Systems LLC.