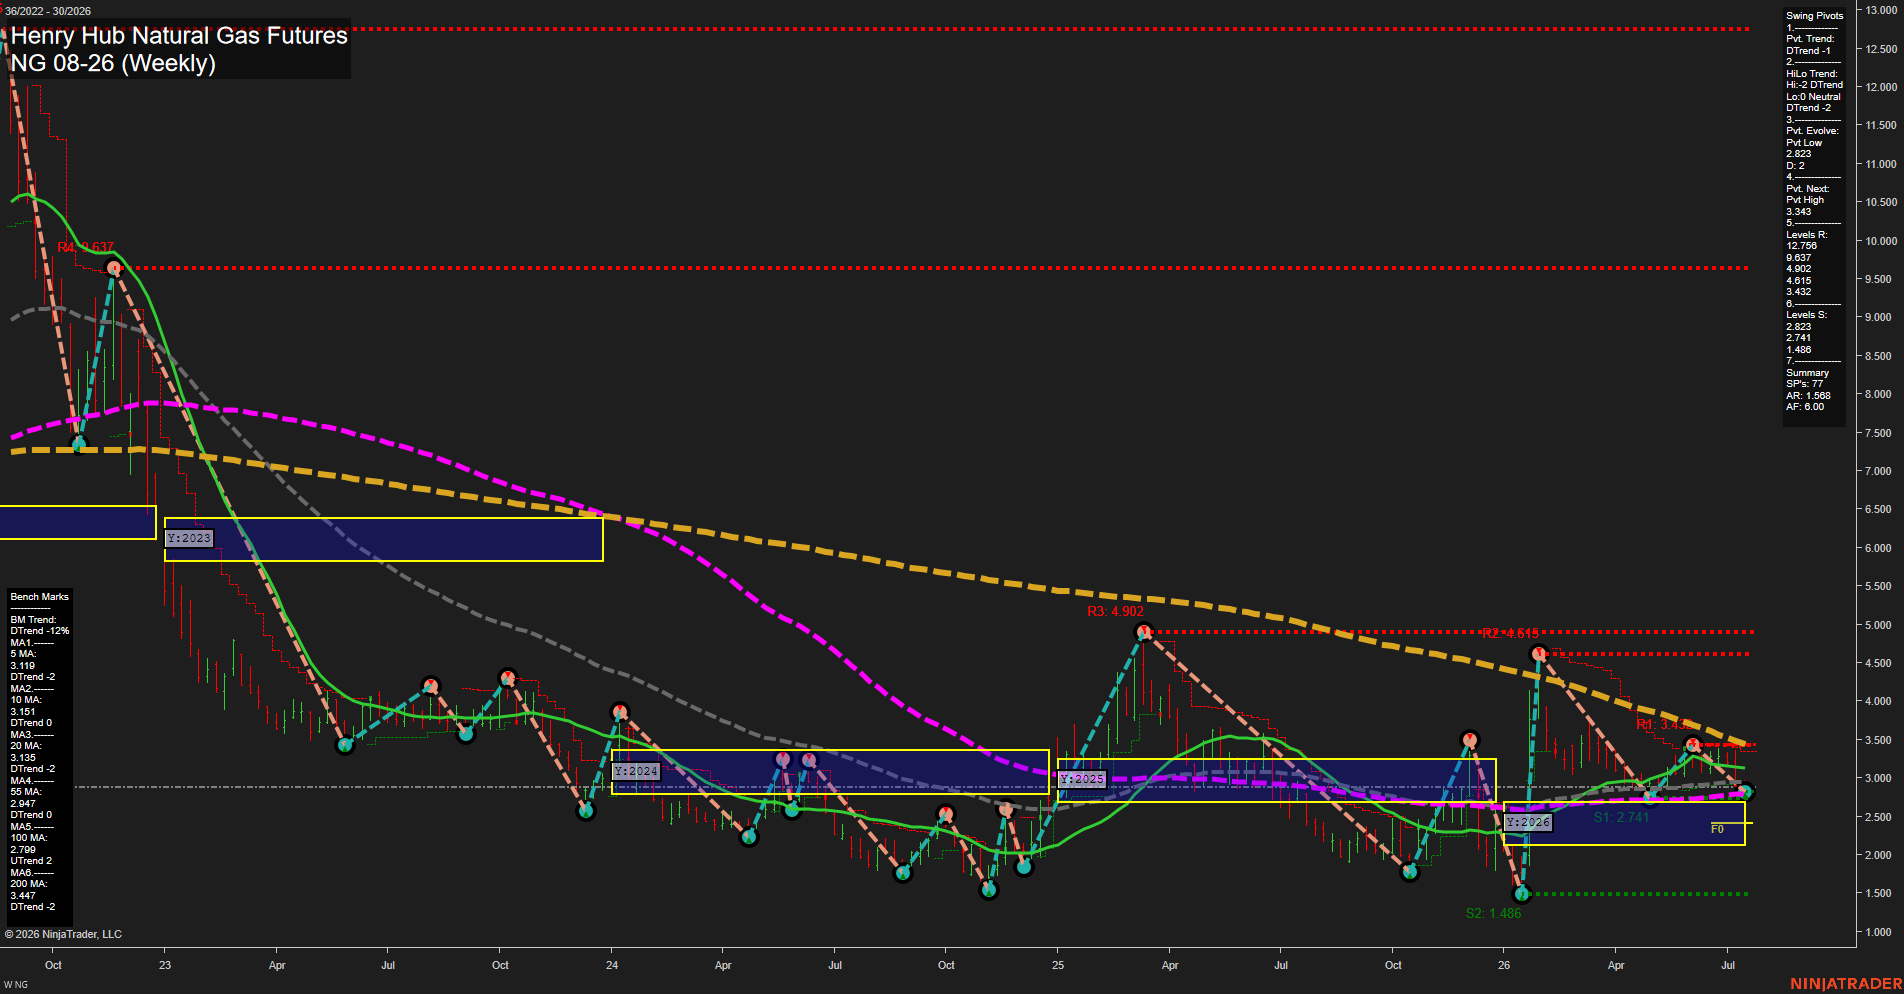
NG Henry Hub Natural Gas Futures Weekly Chart Analysis: 2026-Jul-21 07:05 CT
Price Action
- Last: 2.823,
- Bars: Small,
- Mom: slow.
WSFG Weekly
- Short-Term
- WSFG Current: -2%
- F0%/NTZ' Bias: Price Below,
- WSFG Trend: Down.
MSFG Month Jul
- Intermediate-Term
- MSFG Current: -88%
- F0%/NTZ' Bias: Price Below,
- MSFG Trend: Down.
YSFG Year 2026
- Long-Term
- YSFG Current: 16%
- F0%/NTZ' Bias: Price Above,
- YSFG Trend: Up.
Swing Pivots
- (Short-Term) 1. Pvt. Trend: DTrend,
- (Intermediate-Term) 2. HiLo Trend: DTrend,
- 3. Pvt. Evolve: Pvt low 2.823,
- 4. Pvt. Next: Pvt high 3.433,
- 5. Levels R: 9.637, 4.902, 4.615, 3.432,
- 6. Levels S: 2.823, 2.741, 1.486.
Weekly Benchmarks
- (Short-Term) 5 Day: 3.119 Down Trend,
- (Short-Term) 10 Day: 3.510 Down Trend,
- (Intermediate-Term) 20 Day: 3.135 Down Trend,
- (Intermediate-Term) 55 Day: 2.949 Down Trend,
- (Long-Term) 100 Day: 2.799 Up Trend,
- (Long-Term) 200 Day: 3.447 Down Trend.
Recent Trade Signals
- 20 Jul 2026: Short NG 08-26 @ 2.845 Signals.USAR-WSFG
Overall Rating
- Short-Term: Bearish,
- Intermediate-Term: Bearish,
- Long-Term: Neutral.
Key Insights Summary
Price is consolidating with small weekly bars near the 2.823 pivot-low area after a sharp recovery and subsequent rejection below the 3.432 pivot-high resistance zone. Short-term and intermediate-term structure remains bearish: price is below the weekly and monthly F0% areas, the pivot and HiLo trends are down, and price remains beneath the 5, 10, 20, and 55 period benchmarks. The 2.741 support is the nearby structural reference below the current pivot low, while 3.432 is the first meaningful swing resistance. The yearly grid remains positive and the rising 100 period benchmark is below price, creating a longer-term countertrend underpinning within an otherwise bearish weekly and monthly swing structure.
Chart Analysis ATS AI Generated: 2026-07-21 07:05 for Informational use only, not trading advice. Terms and Risk Disclosure Copyright © 2026. Algo Trading Systems LLC.