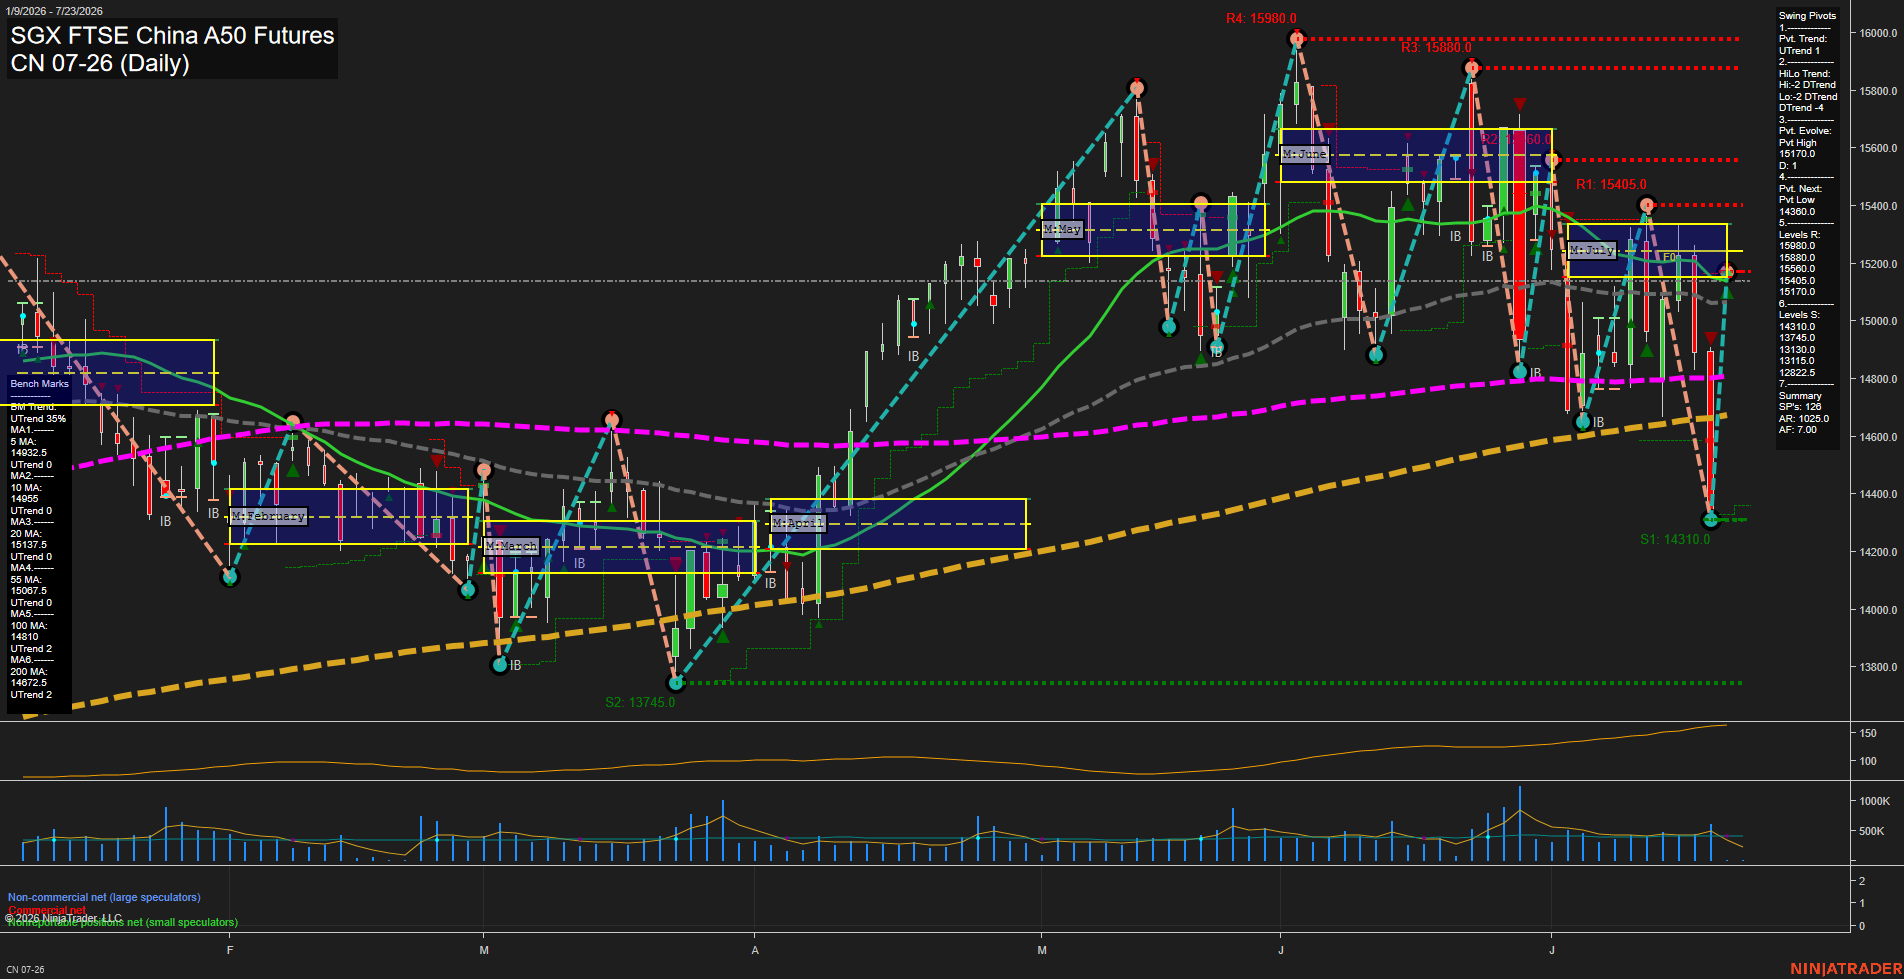
CN SGX FTSE China A50 Futures Daily Chart Analysis: 2026-Jul-21 07:02 CT
Price Action
- Last: 15170.0,
- Bars: Large,
- Mom: fast.
WSFG Weekly
- Short-Term
- WSFG Current: NA%
- F0%/NTZ' Bias: Price Neutral,
- WSFG Trend: Neutral.
MSFG Month Jul
- Intermediate-Term
- MSFG Current: NA%
- F0%/NTZ' Bias: Price Neutral,
- MSFG Trend: Neutral.
YSFG Year 2026
- Long-Term
- YSFG Current: NA%
- F0%/NTZ' Bias: Price Neutral,
- YSFG Trend: Neutral.
Swing Pivots
- (Short-Term) 1. Pvt. Trend: UTrend,
- (Intermediate-Term) 2. HiLo Trend: DTrend,
- 3. Pvt. Evolve: Pvt high 15170.0,
- 4. Pvt. Next: Pvt low 14380.0,
- 5. Levels R: 15980.0, 15880.0, 15600.0, 15405.0,
- 6. Levels S: 14310.0, 13745.0, 13130.0, 13115.0.
Daily Benchmarks
- (Short-Term) 5 Day: 14932.5 Up Trend,
- (Short-Term) 10 Day: 14955.0 Up Trend,
- (Intermediate-Term) 20 Day: 15137.5 Up Trend,
- (Intermediate-Term) 55 Day: 15087.5 Up Trend,
- (Long-Term) 100 Day: 14810.0 Up Trend,
- (Long-Term) 200 Day: 14672.5 Up Trend.
Additional Metrics
- ATR: 102.5,
- VOLMA: 261842.
Overall Rating
- Short-Term: Bullish,
- Intermediate-Term: Neutral,
- Long-Term: Bullish.
Key Insights Summary
Price has produced a sharp V-shaped rebound from the 14310.0 pivot-support area and has reclaimed the 5, 10, 20, and 55-day benchmarks. The short-term pivot trend is upward with fast momentum, while the intermediate HiLo structure remains downward following the sequence of volatile lower highs from the 15980.0 region. The 15405.0 to 15600.0 resistance band defines the next overhead swing zone, while 14310.0 remains the major recent downside reference. Long-term structure remains constructive because price is above the rising 100- and 200-day averages, although the wide daily ATR and recent large reversal bars reflect an exceptionally choppy, high-volatility swing environment.
Chart Analysis ATS AI Generated: 2026-07-21 07:02 for Informational use only, not trading advice. Terms and Risk Disclosure Copyright © 2026. Algo Trading Systems LLC.