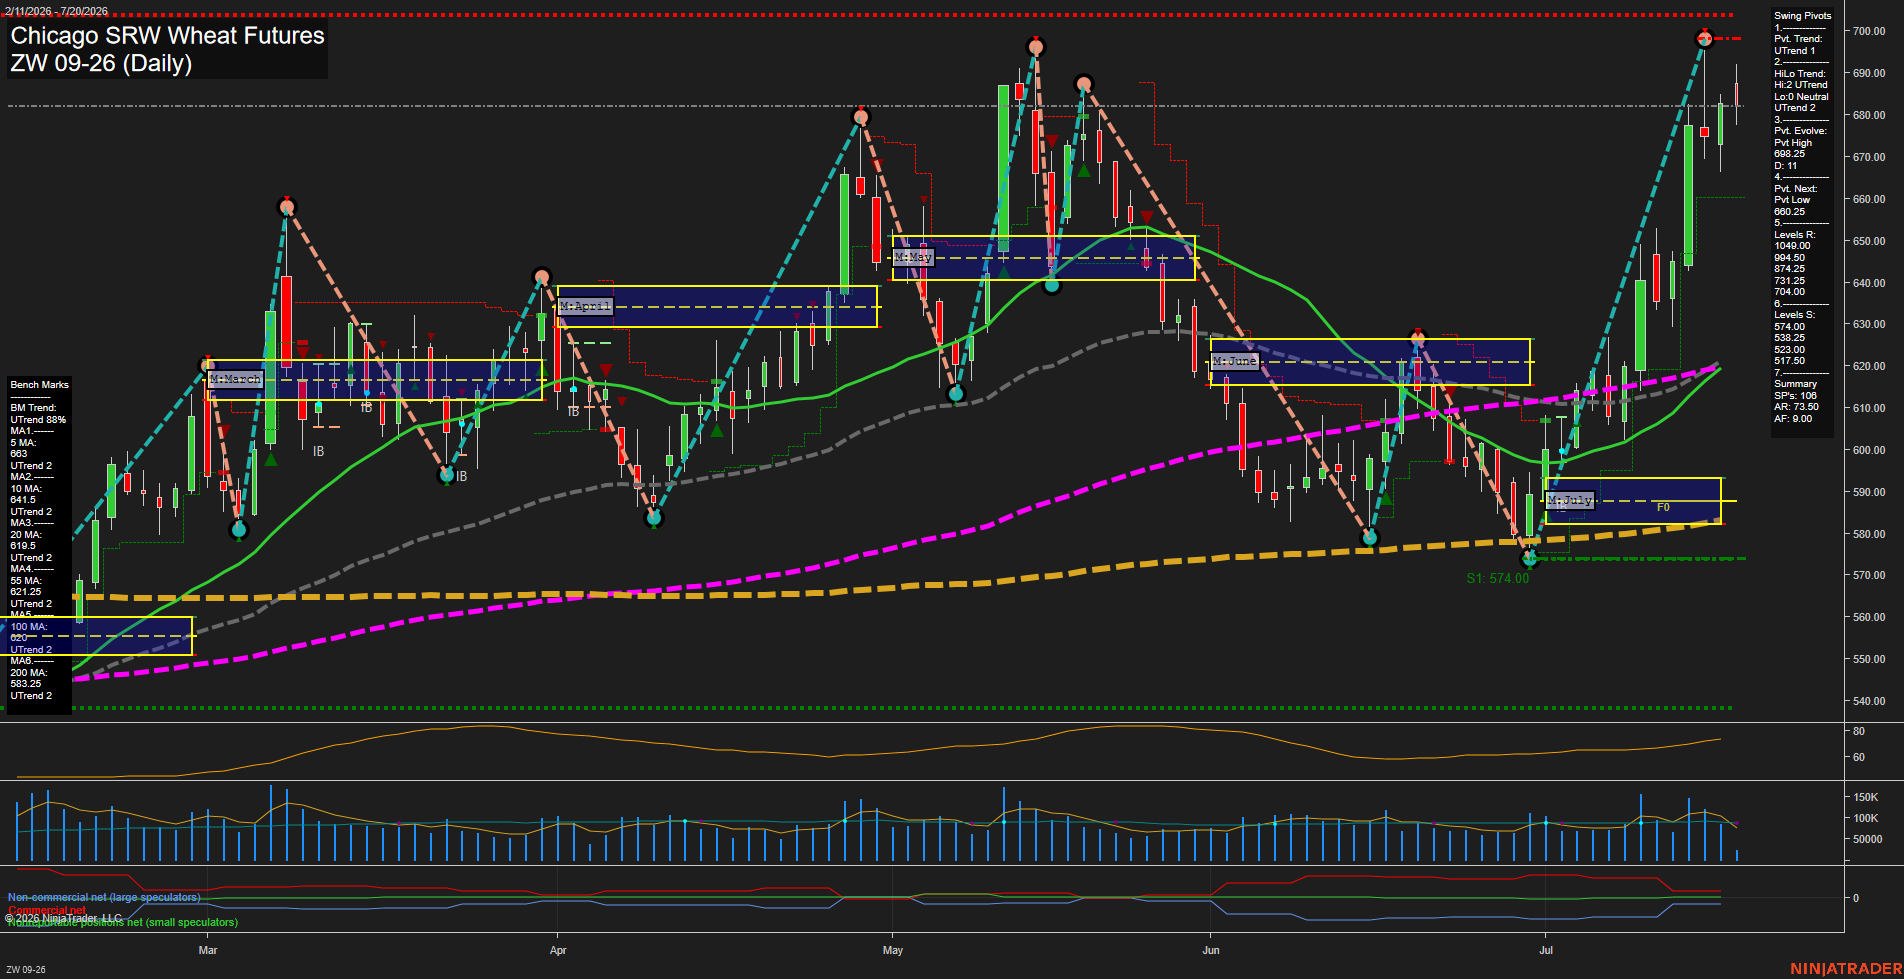
ZW Chicago SRW Wheat Futures Daily Chart Analysis: 2026-Jul-20 07:11 CT
Price Action
- Last: 684.25,
- Bars: Large,
- Mom: fast.
WSFG Weekly
- Short-Term
- WSFG Current: -13%
- F0%/NTZ' Bias: Price Below,
- WSFG Trend: Down.
MSFG Month Jul
- Intermediate-Term
- MSFG Current: 118%
- F0%/NTZ' Bias: Price Above,
- MSFG Trend: Up.
YSFG Year 2026
- Long-Term
- YSFG Current: 61%
- F0%/NTZ' Bias: Price Above,
- YSFG Trend: Up.
Swing Pivots
- (Short-Term) 1. Pvt. Trend: UTrend,
- (Intermediate-Term) 2. HiLo Trend: UTrend,
- 3. Pvt. Evolve: Pvt high 698.25,
- 4. Pvt. Next: Pvt low 660.25,
- 5. Levels R: 1040.00, 994.50, 874.25, 731.25, 704.00,
- 6. Levels S: 574.00, 538.25, 523.00, 517.50.
Daily Benchmarks
- (Short-Term) 5 Day: 663.00 Up Trend,
- (Short-Term) 10 Day: 641.50 Up Trend,
- (Intermediate-Term) 20 Day: 619.50 Up Trend,
- (Intermediate-Term) 55 Day: 621.25 Up Trend,
- (Long-Term) 100 Day: 622.00 Up Trend,
- (Long-Term) 200 Day: 583.25 Up Trend.
Additional Metrics
Overall Rating
- Short-Term: Bullish,
- Intermediate-Term: Bullish,
- Long-Term: Bullish.
Key Insights Summary
Price has produced a sharp July recovery from the 574.00 pivot low and is trading above every benchmark average, with the pivot structure maintaining an UTrend. The advance is fast and volatile, approaching the active 698.25 pivot-high reversal threshold and the 704.00 resistance level. Weekly fib positioning remains below its F0% level, indicating the strong daily rally is occurring against a softer weekly grid backdrop, while monthly and yearly grids remain positive. The intermediate and long-term structure is supported by rising 20-, 55-, 100-, and 200-day benchmarks, with 660.25 defining the next pivot-reversal level beneath the current advance.
Chart Analysis ATS AI Generated: 2026-07-20 07:11 for Informational use only, not trading advice. Terms and Risk Disclosure Copyright © 2026. Algo Trading Systems LLC.