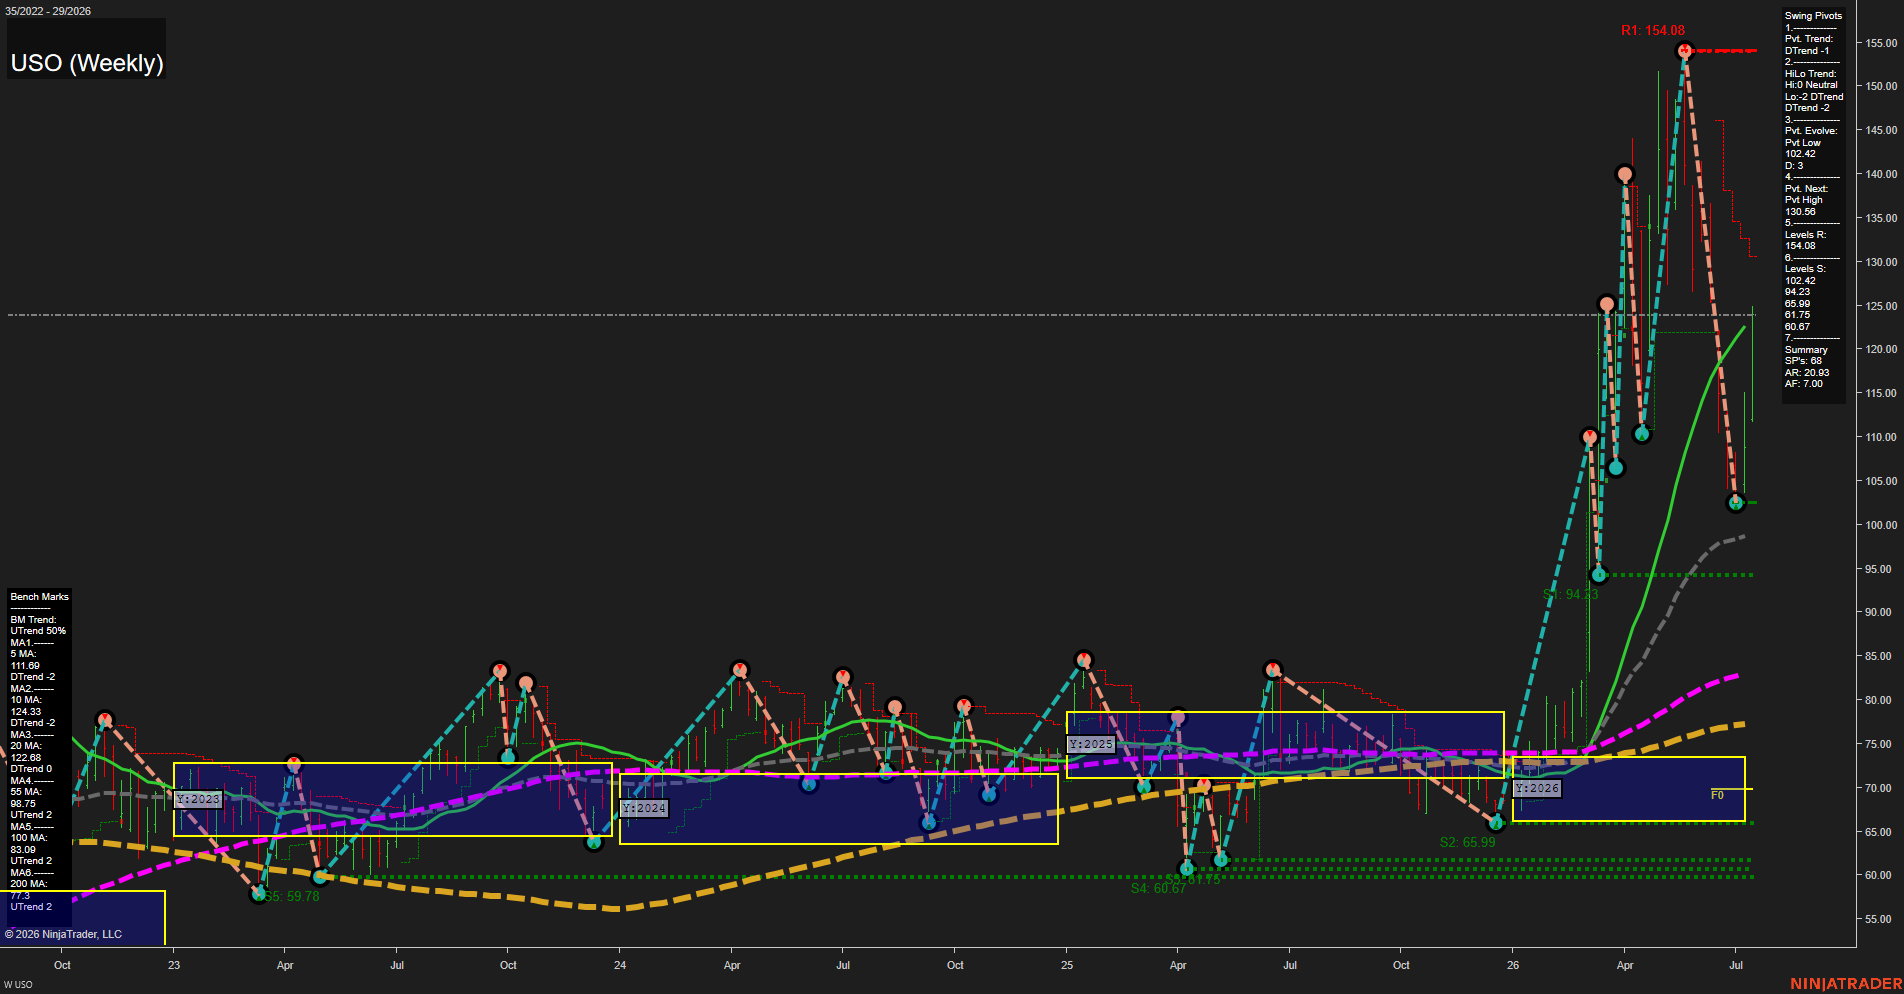
USO United States Oil Fund LP Weekly Chart Analysis: 2026-Jul-20 07:09 CT
Price Action
- Last: 124.33,
- Bars: Large,
- Mom: fast.
WSFG Weekly
- Short-Term
- WSFG Current: NA%
- F0%/NTZ' Bias: Price Above NTZ,
- WSFG Trend: Uptrend.
MSFG Month Jul
- Intermediate-Term
- MSFG Current: NA%
- F0%/NTZ' Bias: Price Above NTZ,
- MSFG Trend: Uptrend.
YSFG Year 2026
- Long-Term
- YSFG Current: 177.61%
- F0%/NTZ' Bias: Price Above NTZ,
- YSFG Trend: Uptrend.
Swing Pivots
- (Short-Term) 1. Pvt. Trend: DTrend,
- (Intermediate-Term) 2. HiLo Trend: DTrend,
- 3. Pvt. Evolve: Pvt low 102.42,
- 4. Pvt. Next: Pvt high 130.56,
- 5. Levels R: 154.08,
- 6. Levels S: 102.42, 94.23, 65.99, 61.75, 60.67.
Weekly Benchmarks
- (Short-Term) 5 Day: 111.69 Down Trend,
- (Short-Term) 10 Day: 124.33 Down Trend,
- (Intermediate-Term) 20 Day: 122.49 Down Trend,
- (Intermediate-Term) 55 Day: 98.75 Up Trend,
- (Long-Term) 100 Day: 83.09 Up Trend,
- (Long-Term) 200 Day: 77.30 Up Trend.
Overall Rating
- Short-Term: Bearish,
- Intermediate-Term: Neutral,
- Long-Term: Bullish.
Key Insights Summary
USO remains in a long-term expansion above the 55, 100, and 200-week benchmarks and well above the 2026 yearly NTZ, reflecting a major upside repricing in the oil complex. The short-term structure is corrective following rejection from the 154.08 pivot resistance, with the active pivot sequence still classified as a DTrend. Price has rebounded sharply from the 102.42 pivot low and is testing the 10 and 20-week benchmark area near 122.49 to 124.33. The 130.56 next-pivot threshold defines the nearby recovery level, while 102.42 is the principal structural support separating the current retracement from a renewed deeper decline.
Chart Analysis ATS AI Generated: 2026-07-20 07:09 for Informational use only, not trading advice. Terms and Risk Disclosure Copyright © 2026. Algo Trading Systems LLC.