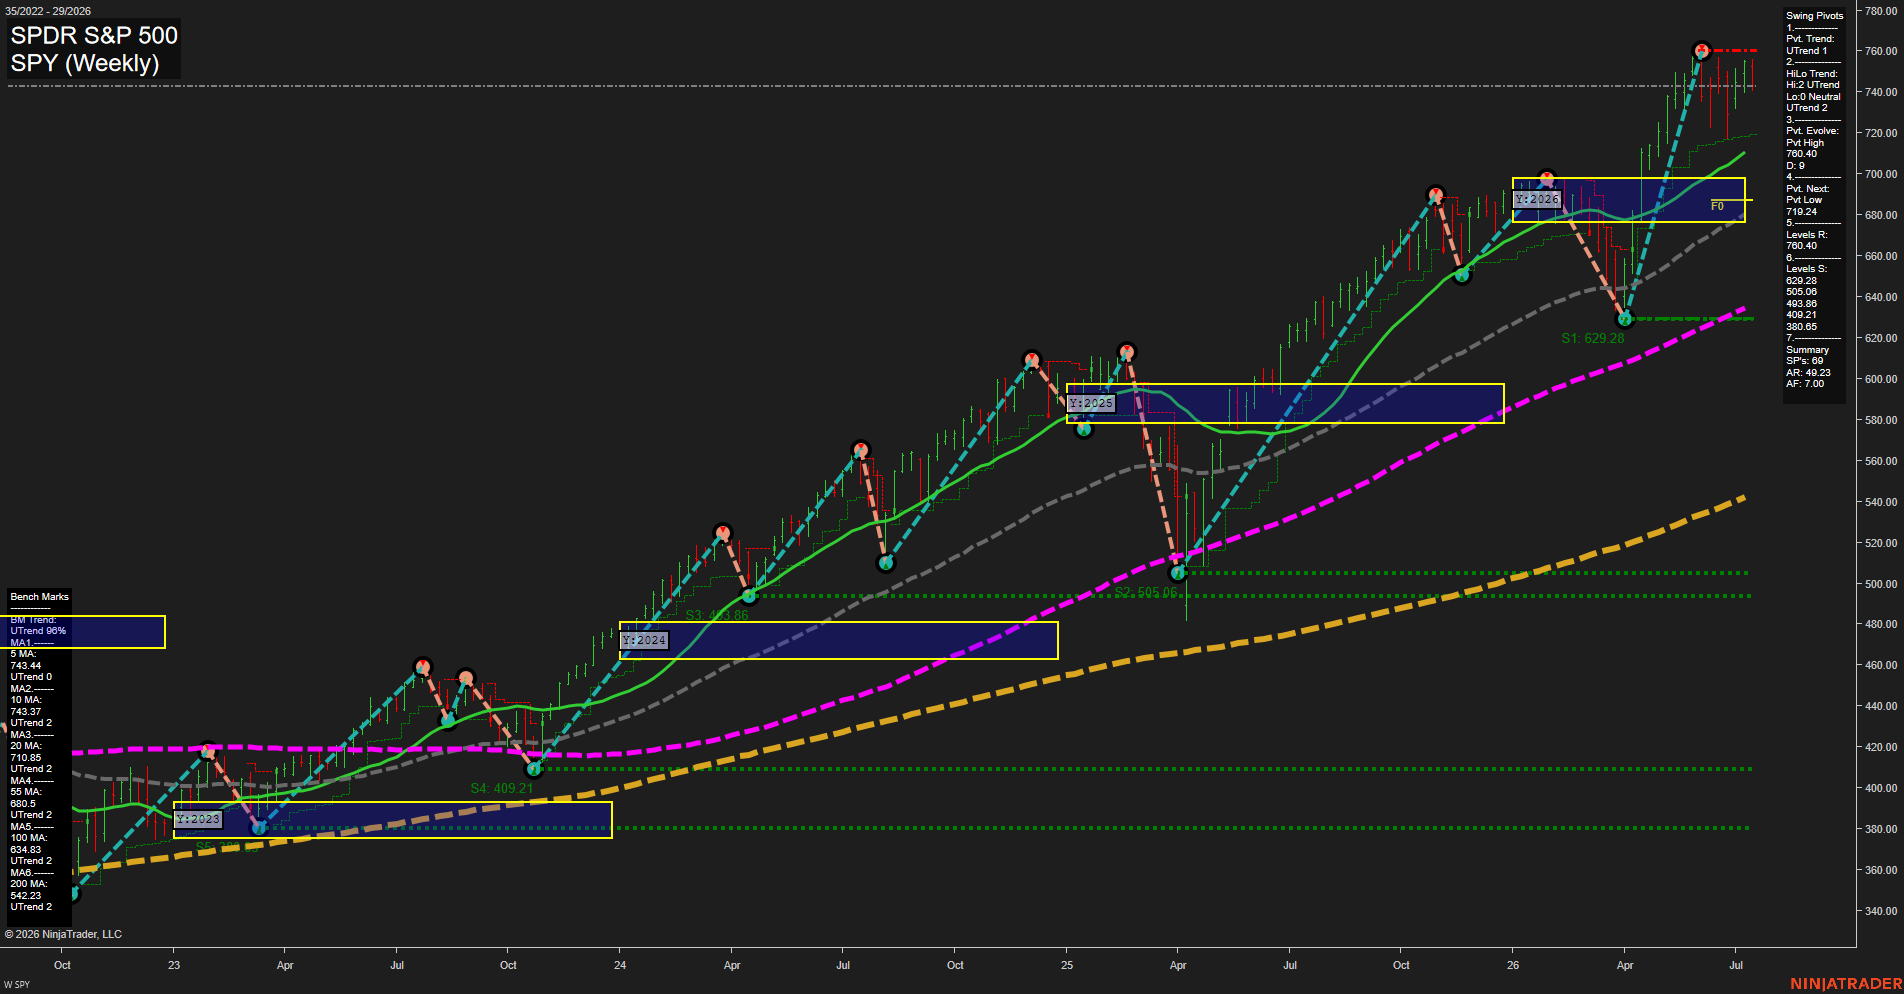
SPY SPDR S&P 500 Weekly Chart Analysis: 2026-Jul-20 07:08 CT
Price Action
- Last: 751.00,
- Bars: Small,
- Mom: Average.
WSFG Weekly
- Short-Term
- WSFG Current: NA%
- F0%/NTZ' Bias: Price Bullish,
- WSFG Trend: Bullish.
MSFG Month Jul
- Intermediate-Term
- MSFG Current: NA%
- F0%/NTZ' Bias: Price Bullish,
- MSFG Trend: Bullish.
YSFG Year 2026
- Long-Term
- YSFG Current: NA%
- F0%/NTZ' Bias: Price Bullish,
- YSFG Trend: Bullish.
Swing Pivots
- (Short-Term) 1. Pvt. Trend: UTrend,
- (Intermediate-Term) 2. HiLo Trend: UTrend,
- 3. Pvt. Evolve: Pvt high 760.40,
- 4. Pvt. Next: Pvt low 719.24,
- 5. Levels R: 760.40,
- 6. Levels S: 629.28, 505.06, 493.38, 409.21, 380.65, 370.07.
Weekly Benchmarks
- (Short-Term) 5 Day: 743.44 Up Trend,
- (Short-Term) 10 Day: 743.37 Up Trend,
- (Intermediate-Term) 20 Day: 710.85 Up Trend,
- (Intermediate-Term) 55 Day: 680.50 Up Trend,
- (Long-Term) 100 Day: 634.83 Up Trend,
- (Long-Term) 200 Day: 542.25 Up Trend.
Overall Rating
- Short-Term: Bullish,
- Intermediate-Term: Bullish,
- Long-Term: Bullish.
Key Insights Summary
SPY remains in a broad weekly expansion phase that translates to a positive ES futures swing-trend backdrop. Price is consolidating just beneath the 760.40 pivot-high resistance after a sharp V-style recovery from the 629.28 swing low, with small weekly bars indicating compression rather than a material loss of trend control. The aligned rising 5-, 10-, 20-, 55-, 100-, and 200-period benchmarks confirm participation across all trend horizons. The 719.24 pivot-next level defines the nearest structural reversal threshold, while the yearly F0% and NTZ area near the upper-680s to upper-690s has shifted into a deeper support zone beneath current trade.
Chart Analysis ATS AI Generated: 2026-07-20 07:08 for Informational use only, not trading advice. Terms and Risk Disclosure Copyright © 2026. Algo Trading Systems LLC.