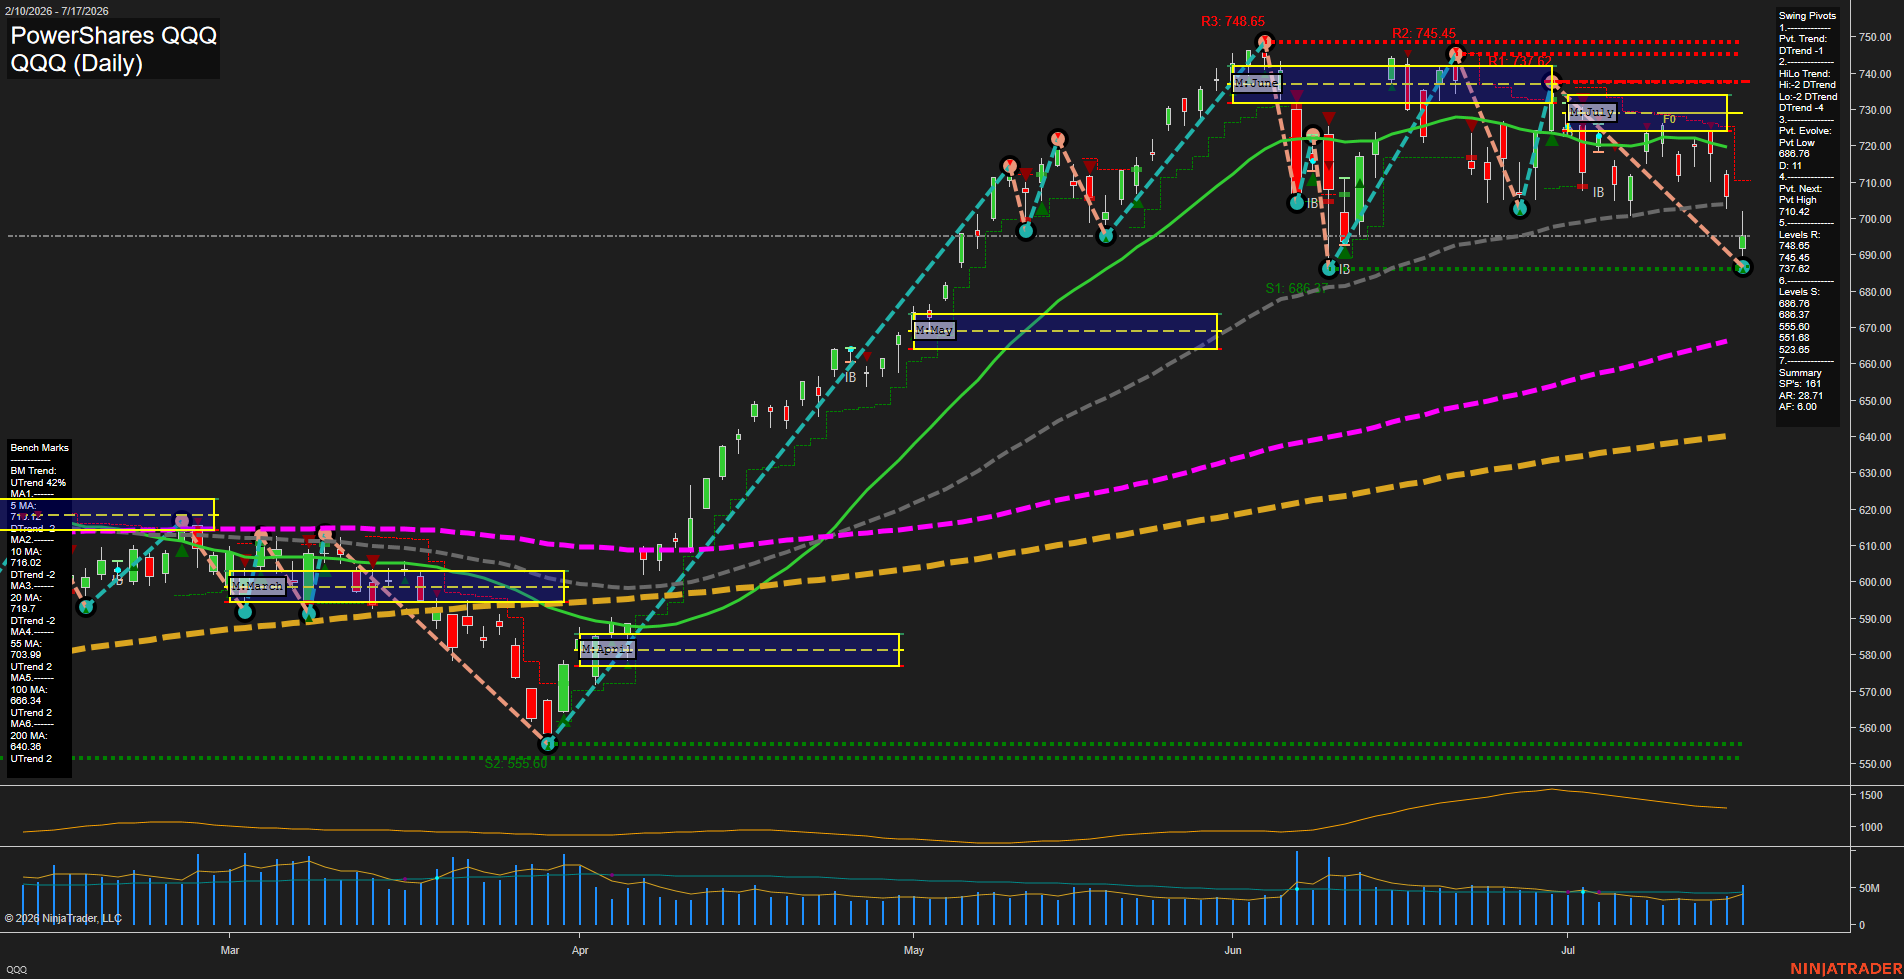
QQQ PowerShares QQQ Daily Chart Analysis: 2026-Jul-20 07:06 CT
Price Action
- Last: 695.00,
- Bars: Medium,
- Mom: Average.
WSFG Weekly
- Short-Term
- WSFG Current: NA%
- F0%/NTZ' Bias: Price Neutral,
- WSFG Trend: Neutral.
MSFG Month Jul
- Intermediate-Term
- MSFG Current: NA%
- F0%/NTZ' Bias: Price Bearish,
- MSFG Trend: Bearish.
YSFG Year 2026
- Long-Term
- YSFG Current: NA%
- F0%/NTZ' Bias: Price Neutral,
- YSFG Trend: Neutral.
Swing Pivots
- (Short-Term) 1. Pvt. Trend: DTrend,
- (Intermediate-Term) 2. HiLo Trend: DTrend,
- 3. Pvt. Evolve: Pvt low 686.76,
- 4. Pvt. Next: Pvt high 710.42,
- 5. Levels R: 748.65, 745.45, 737.62,
- 6. Levels S: 688.37, 686.76, 555.60, 551.68, 529.88.
Daily Benchmarks
- (Short-Term) 5 Day: 715.41 Up Trend,
- (Short-Term) 10 Day: 716.02 Down Trend,
- (Intermediate-Term) 20 Day: 719.72 Down Trend,
- (Intermediate-Term) 55 Day: 703.09 Up Trend,
- (Long-Term) 100 Day: 686.91 Up Trend,
- (Long-Term) 200 Day: 640.36 Up Trend.
Additional Metrics
- ATR: 28.71,
- VOLMA: 32709273.
Overall Rating
- Short-Term: Bearish,
- Intermediate-Term: Bearish,
- Long-Term: Bullish.
Key Insights Summary
QQQ is in a short-term and intermediate-term corrective downswing, with price below the 5, 10, 20, and 55-day benchmarks and below the July monthly Fib-grid lower area. The pivot structure remains DTrend on both time horizons, while the 686.76 to 688.37 support cluster is the active downside reference area. The rebound into 695.00 remains beneath the 710.42 next-pivot reversal level and reflects a countertrend bounce within the recent lower-high sequence. From a futures swing-trader perspective, the longer-term structure remains constructive because price is holding marginally above the rising 100-day average and materially above the rising 200-day average, but near-term order flow remains corrective and choppy beneath the 703.09 to 719.72 moving-average band.
Chart Analysis ATS AI Generated: 2026-07-20 07:06 for Informational use only, not trading advice. Terms and Risk Disclosure Copyright © 2026. Algo Trading Systems LLC.