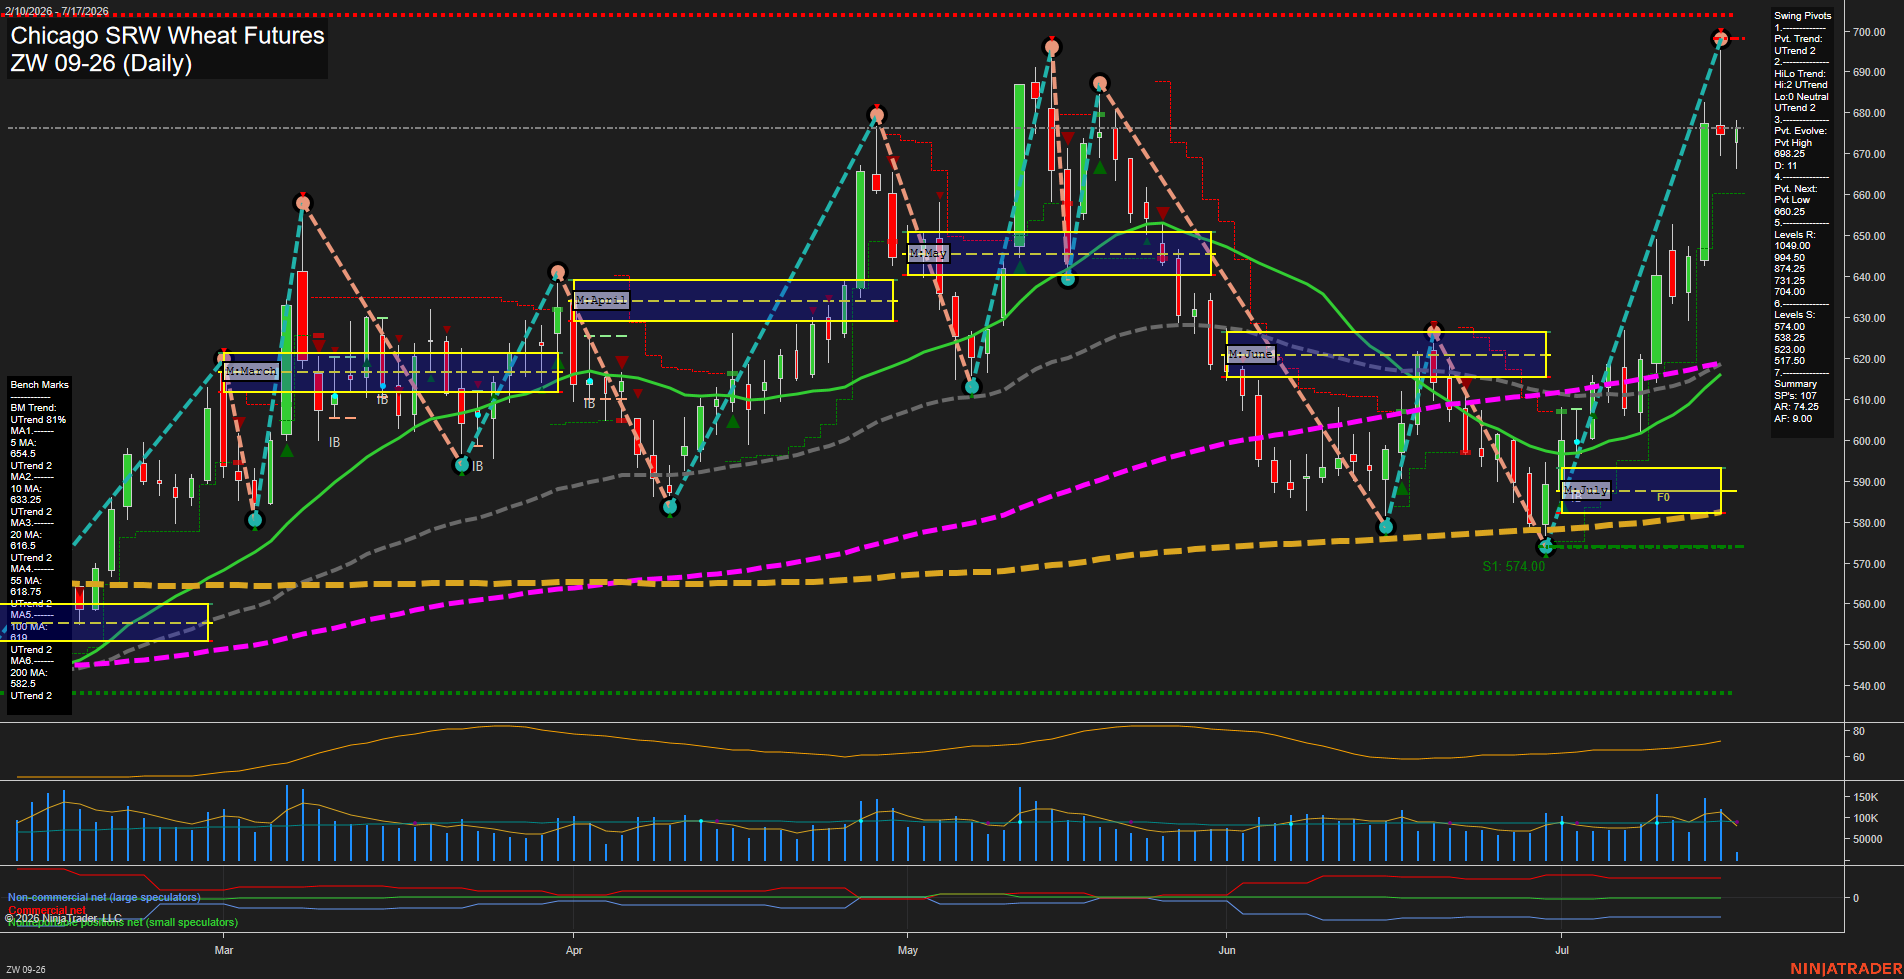
ZW Chicago SRW Wheat Futures Daily Chart Analysis: 2026-Jul-17 07:10 CT
Price Action
- Last: 676.00,
- Bars: Small,
- Mom: fast.
WSFG Weekly
- Short-Term
- WSFG Current: 82%
- F0%/NTZ' Bias: Price Above,
- WSFG Trend: Up.
MSFG Month Jul
- Intermediate-Term
- MSFG Current: 110%
- F0%/NTZ' Bias: Price Above,
- MSFG Trend: Up.
YSFG Year 2026
- Long-Term
- YSFG Current: 58%
- F0%/NTZ' Bias: Price Above,
- YSFG Trend: Up.
Swing Pivots
- (Short-Term) 1. Pvt. Trend: UTrend,
- (Intermediate-Term) 2. HiLo Trend: UTrend,
- 3. Pvt. Evolve: Pvt high 698.25,
- 4. Pvt. Next: Pvt low 680.25,
- 5. Levels R: 704.50, 694.50, 674.25, 634.20, 624.00,
- 6. Levels S: 574.00, 538.25, 523.00, 517.50.
Daily Benchmarks
- (Short-Term) 5 Day: 654.50 Up Trend,
- (Short-Term) 10 Day: 633.25 Up Trend,
- (Intermediate-Term) 20 Day: 616.50 Up Trend,
- (Intermediate-Term) 55 Day: 618.75 Up Trend,
- (Long-Term) 100 Day: 619.00 Up Trend,
- (Long-Term) 200 Day: 582.50 Up Trend.
Additional Metrics
Recent Trade Signals
- 10 Jul 2026: Long ZW 09-26 @ 614.5 Signals.USAR-MSFG
Overall Rating
- Short-Term: Bullish,
- Intermediate-Term: Bullish,
- Long-Term: Bullish.
Key Insights Summary
Price has completed a sharp V-shaped recovery from the early-July 574.00 pivot low and is now holding materially above the rising 5-, 10-, 20-, 55-, 100-, and 200-day benchmarks. Weekly, monthly, and yearly Fib-grid readings remain above their F0% reference areas, aligning with the UTrend pivot structure. The recent advance is fast and has pushed into the 674.25 to 694.50 resistance zone, while the evolving 698.25 pivot high defines the immediate upside swing reference. Small bars near 676.00 indicate consolidation after the vertical rally rather than broad price rejection, with 680.25 identified as the next pivot-reversal reference and 574.00 remaining the principal lower support.
Chart Analysis ATS AI Generated: 2026-07-17 07:10 for Informational use only, not trading advice. Terms and Risk Disclosure Copyright © 2026. Algo Trading Systems LLC.