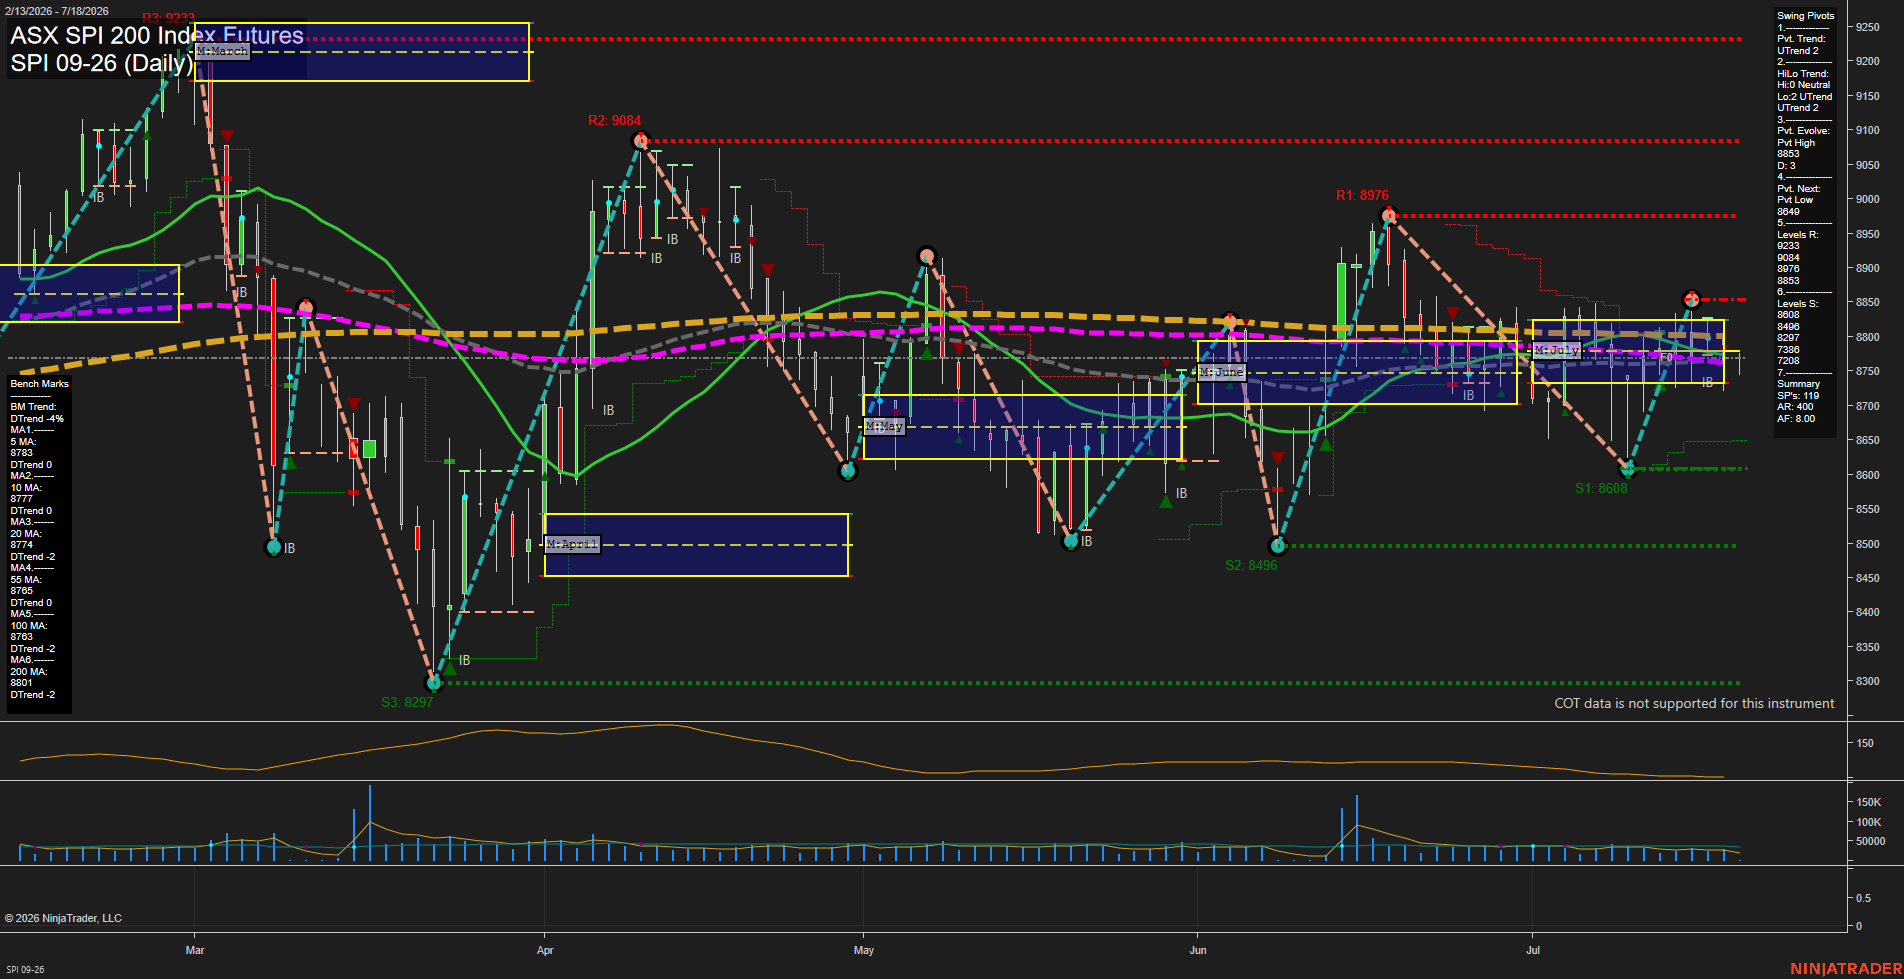
SPI ASX SPI 200 Index Futures Daily Chart Analysis: 2026-Jul-17 07:07 CT
Price Action
- Last: 8783,
- Bars: Small,
- Mom: slow.
WSFG Weekly
- Short-Term
- WSFG Current: NA%
- F0%/NTZ' Bias: Price Neutral,
- WSFG Trend: Neutral.
MSFG Month Jul
- Intermediate-Term
- MSFG Current: NA%
- F0%/NTZ' Bias: Price Neutral,
- MSFG Trend: Neutral.
YSFG Year 2026
- Long-Term
- YSFG Current: NA%
- F0%/NTZ' Bias: Price Neutral,
- YSFG Trend: Neutral.
Swing Pivots
- (Short-Term) 1. Pvt. Trend: UTrend,
- (Intermediate-Term) 2. HiLo Trend: UTrend,
- 3. Pvt. Evolve: Pvt high 8853,
- 4. Pvt. Next: Pvt low 8649,
- 5. Levels R: 9233, 9084, 8976, 8853,
- 6. Levels S: 8608, 8496, 8297.
Daily Benchmarks
- (Short-Term) 5 Day: 8783 Down Trend,
- (Short-Term) 10 Day: 8777 Down Trend,
- (Intermediate-Term) 20 Day: 8774 Down Trend,
- (Intermediate-Term) 55 Day: 8785 Down Trend,
- (Long-Term) 100 Day: 8763 Down Trend,
- (Long-Term) 200 Day: 8801 Down Trend.
Additional Metrics
Overall Rating
- Short-Term: Neutral,
- Intermediate-Term: Bearish,
- Long-Term: Bearish.
Key Insights Summary
SPI is consolidating tightly around the 5, 10, 20, 55, and 100-day benchmarks, with small daily bars and slow momentum reflecting a compressed, choppy swing environment. The short-term pivot structure remains upward, but the evolving 8853 pivot high and repeated benchmark congestion show that upside follow-through has not yet developed. Resistance is layered at 8853, 8976, 9084, and 9233, while 8608 is the first material pivot support followed by 8496. All benchmark trends remain down, including the 200-day average at 8801 above price, preserving a broader corrective-to-bearish trend backdrop despite the recent rebound from 8608.
Chart Analysis ATS AI Generated: 2026-07-17 07:07 for Informational use only, not trading advice. Terms and Risk Disclosure Copyright © 2026. Algo Trading Systems LLC.