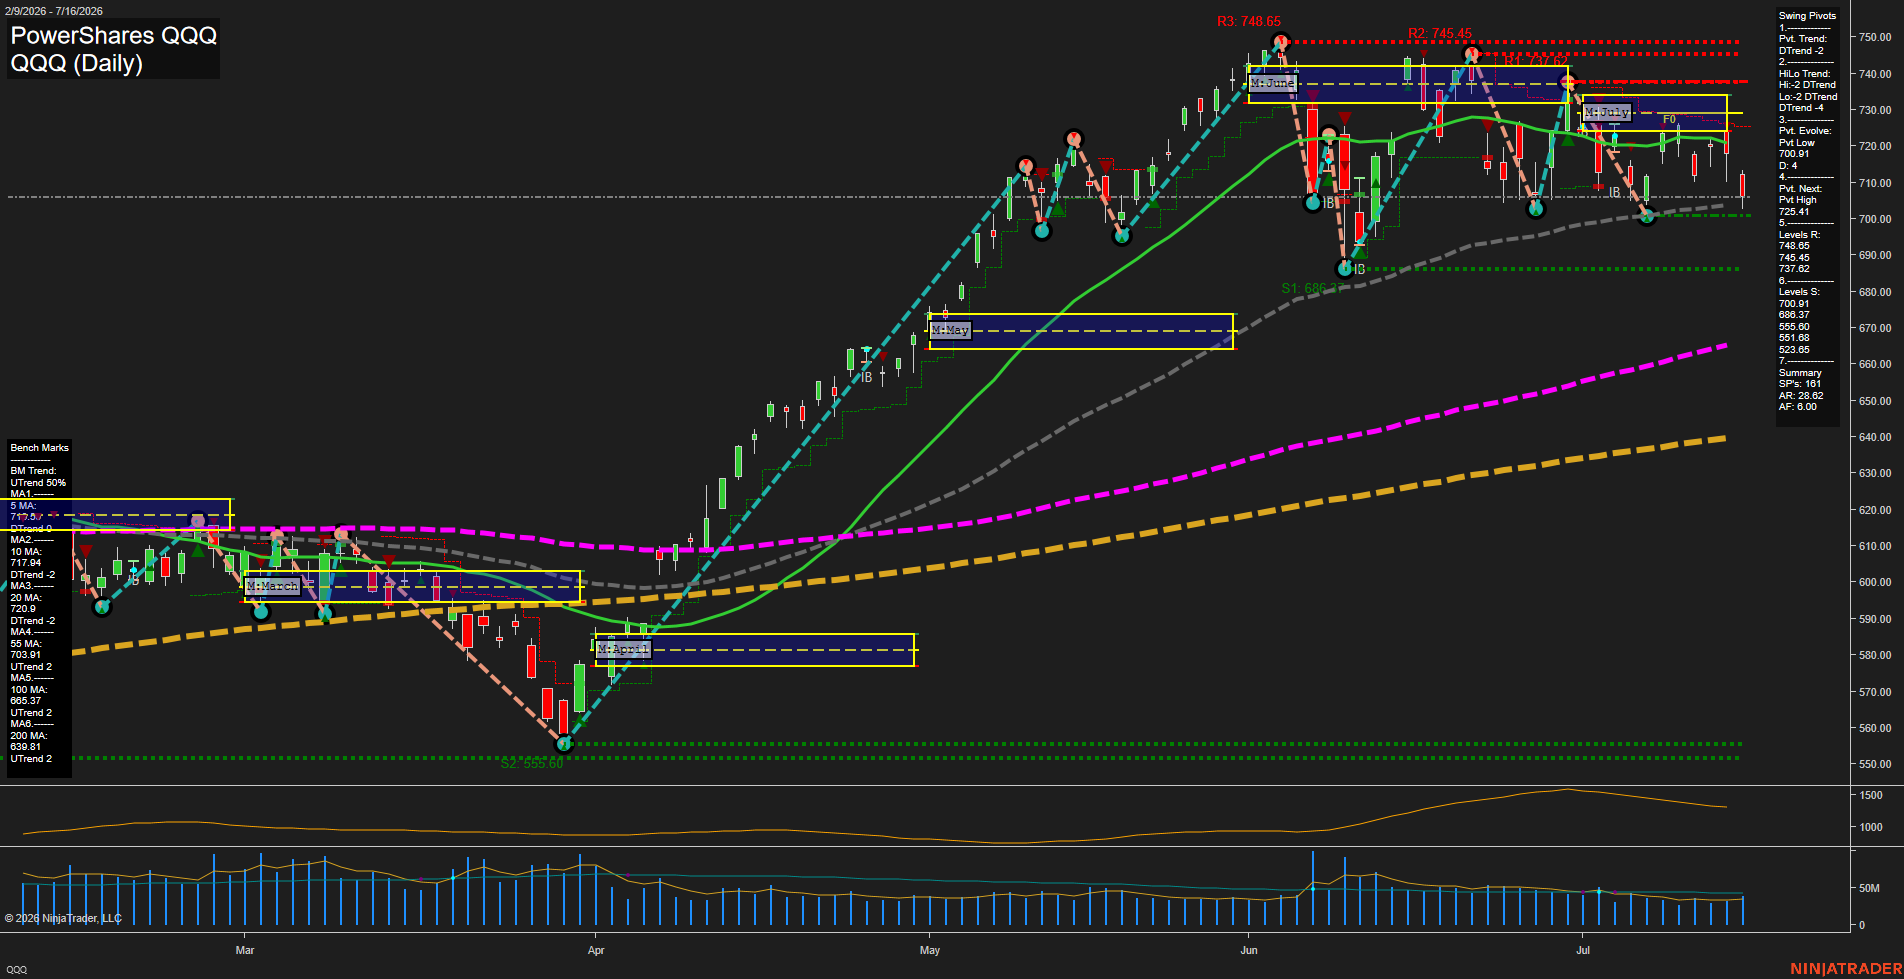
QQQ PowerShares QQQ Daily Chart Analysis: 2026-Jul-17 07:06 CT
Price Action
- Last: 709.81,
- Bars: Medium,
- Mom: Average.
WSFG Weekly
- Short-Term
- WSFG Current: NA%
- F0%/NTZ' Bias: Price Neutral,
- WSFG Trend: Neutral.
MSFG Month Jul
- Intermediate-Term
- MSFG Current: NA%
- F0%/NTZ' Bias: Price Below NTZ,
- MSFG Trend: Down.
YSFG Year 2026
- Long-Term
- YSFG Current: NA%
- F0%/NTZ' Bias: Price Neutral,
- YSFG Trend: Neutral.
Swing Pivots
- (Short-Term) 1. Pvt. Trend: DTrend,
- (Intermediate-Term) 2. HiLo Trend: DTrend,
- 3. Pvt. Evolve: Pvt low 700.91,
- 4. Pvt. Next: Pvt high 725.41,
- 5. Levels R: 748.65, 745.45, 737.62,
- 6. Levels S: 700.91, 688.37, 655.60, 551.68, 523.56.
Daily Benchmarks
- (Short-Term) 5 Day: 717.90 Down Trend,
- (Short-Term) 10 Day: 717.94 Down Trend,
- (Intermediate-Term) 20 Day: 720.44 Down Trend,
- (Intermediate-Term) 55 Day: 703.91 Up Trend,
- (Long-Term) 100 Day: 665.77 Up Trend,
- (Long-Term) 200 Day: 639.81 Up Trend.
Additional Metrics
- ATR: 28.62,
- VOLMA: 32709273.
Overall Rating
- Short-Term: Bearish,
- Intermediate-Term: Bearish,
- Long-Term: Bullish.
Key Insights Summary
QQQ, as a proxy for Nasdaq futures conditions, shows a short-term corrective phase beneath the declining 5-, 10-, and 20-day benchmarks. Both pivot structures are in DTrend, with price testing the 700.91 pivot-low support after rejection from the July NTZ area near the low-720s. The broader futures-style trend remains constructive above the rising 55-, 100-, and 200-day averages, but the current sequence is characterized by lower highs, elevated daily range conditions, and a countertrend pullback within the larger 2026 advance. Resistance is layered at 737.62 through 748.65, while 688.37 is the next visible support beneath the active 700.91 pivot level.
Chart Analysis ATS AI Generated: 2026-07-17 07:06 for Informational use only, not trading advice. Terms and Risk Disclosure Copyright © 2026. Algo Trading Systems LLC.