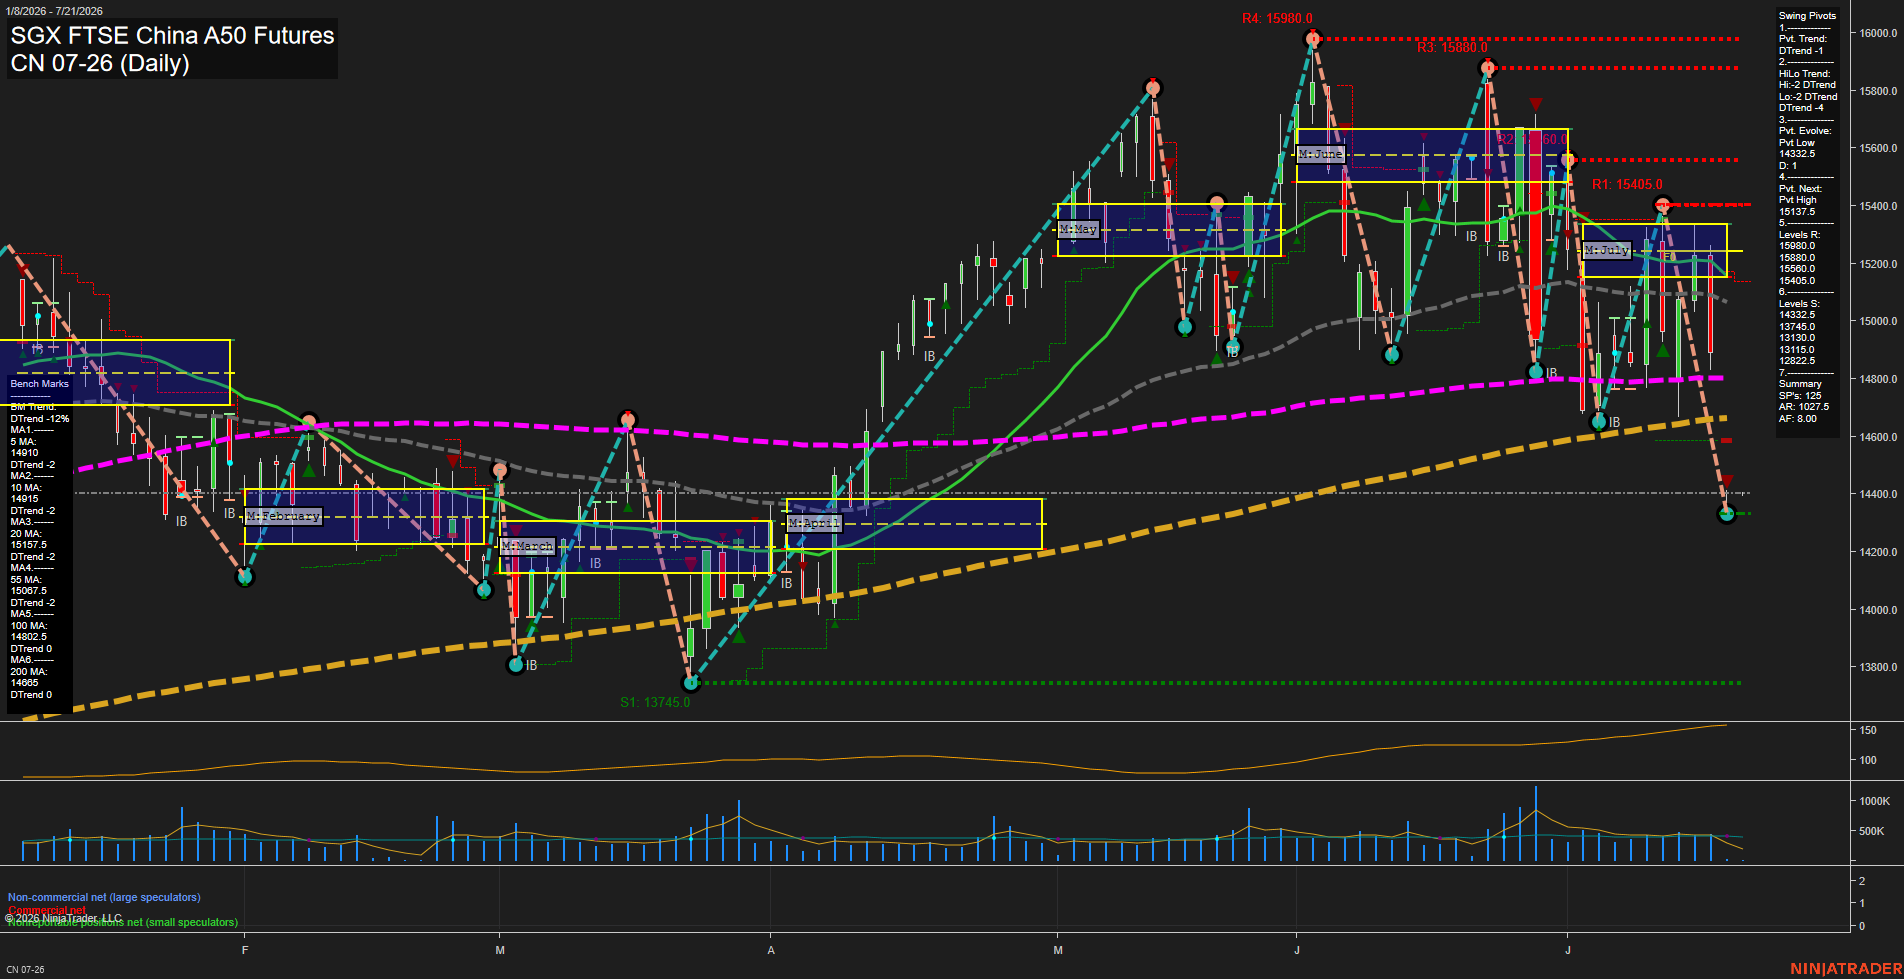
CN SGX FTSE China A50 Futures Daily Chart Analysis: 2026-Jul-17 07:02 CT
Price Action
- Last: 14332.5,
- Bars: Large,
- Mom: fast.
WSFG Weekly
- Short-Term
- WSFG Current: NA%
- F0%/NTZ' Bias: Price Below NTZ,
- WSFG Trend: Bearish.
MSFG Month Jul
- Intermediate-Term
- MSFG Current: NA%
- F0%/NTZ' Bias: Price Below NTZ,
- MSFG Trend: Bearish.
YSFG Year 2026
- Long-Term
- YSFG Current: NA%
- F0%/NTZ' Bias: Price Below NTZ,
- YSFG Trend: Bearish.
Swing Pivots
- (Short-Term) 1. Pvt. Trend: DTrend,
- (Intermediate-Term) 2. HiLo Trend: DTrend,
- 3. Pvt. Evolve: Pvt low 14332.5,
- 4. Pvt. Next: Pvt high 1537.5,
- 5. Levels R: 15980.0, 15880.0, 15680.0, 15405.0,
- 6. Levels S: 14332.5, 13745.0, 13330.0, 13115.0, 12822.5.
Daily Benchmarks
- (Short-Term) 5 Day: 14910.0 Down Trend,
- (Short-Term) 10 Day: 14915.0 Down Trend,
- (Intermediate-Term) 20 Day: 15157.5 Down Trend,
- (Intermediate-Term) 55 Day: 15087.5 Down Trend,
- (Long-Term) 100 Day: 14800.0 Down Trend,
- (Long-Term) 200 Day: 14685.0 Up Trend.
Additional Metrics
- ATR: 87.5,
- VOLMA: 261842.
Overall Rating
- Short-Term: Bearish,
- Intermediate-Term: Bearish,
- Long-Term: Bearish.
Key Insights Summary
Price has transitioned into a fast downside swing, breaking beneath the short, intermediate, and 100-day benchmark cluster. Both pivot trend measures remain in DTrend, with the latest evolving pivot low at 14332.5 confirming lower-low structure. The decline has extended below the July monthly grid and below the rising 200-day benchmark at 14685.0, shifting the longer-cycle structure from prior consolidation into a bearish breakdown. Resistance is layered from 15405.0 through 15980.0, while 14332.5 is the immediate pivot reference ahead of lower historical supports at 13745.0 and 13330.0. Elevated ATR and declining price structure characterize a volatile selloff phase rather than a stable range.
Chart Analysis ATS AI Generated: 2026-07-17 07:02 for Informational use only, not trading advice. Terms and Risk Disclosure Copyright © 2026. Algo Trading Systems LLC.