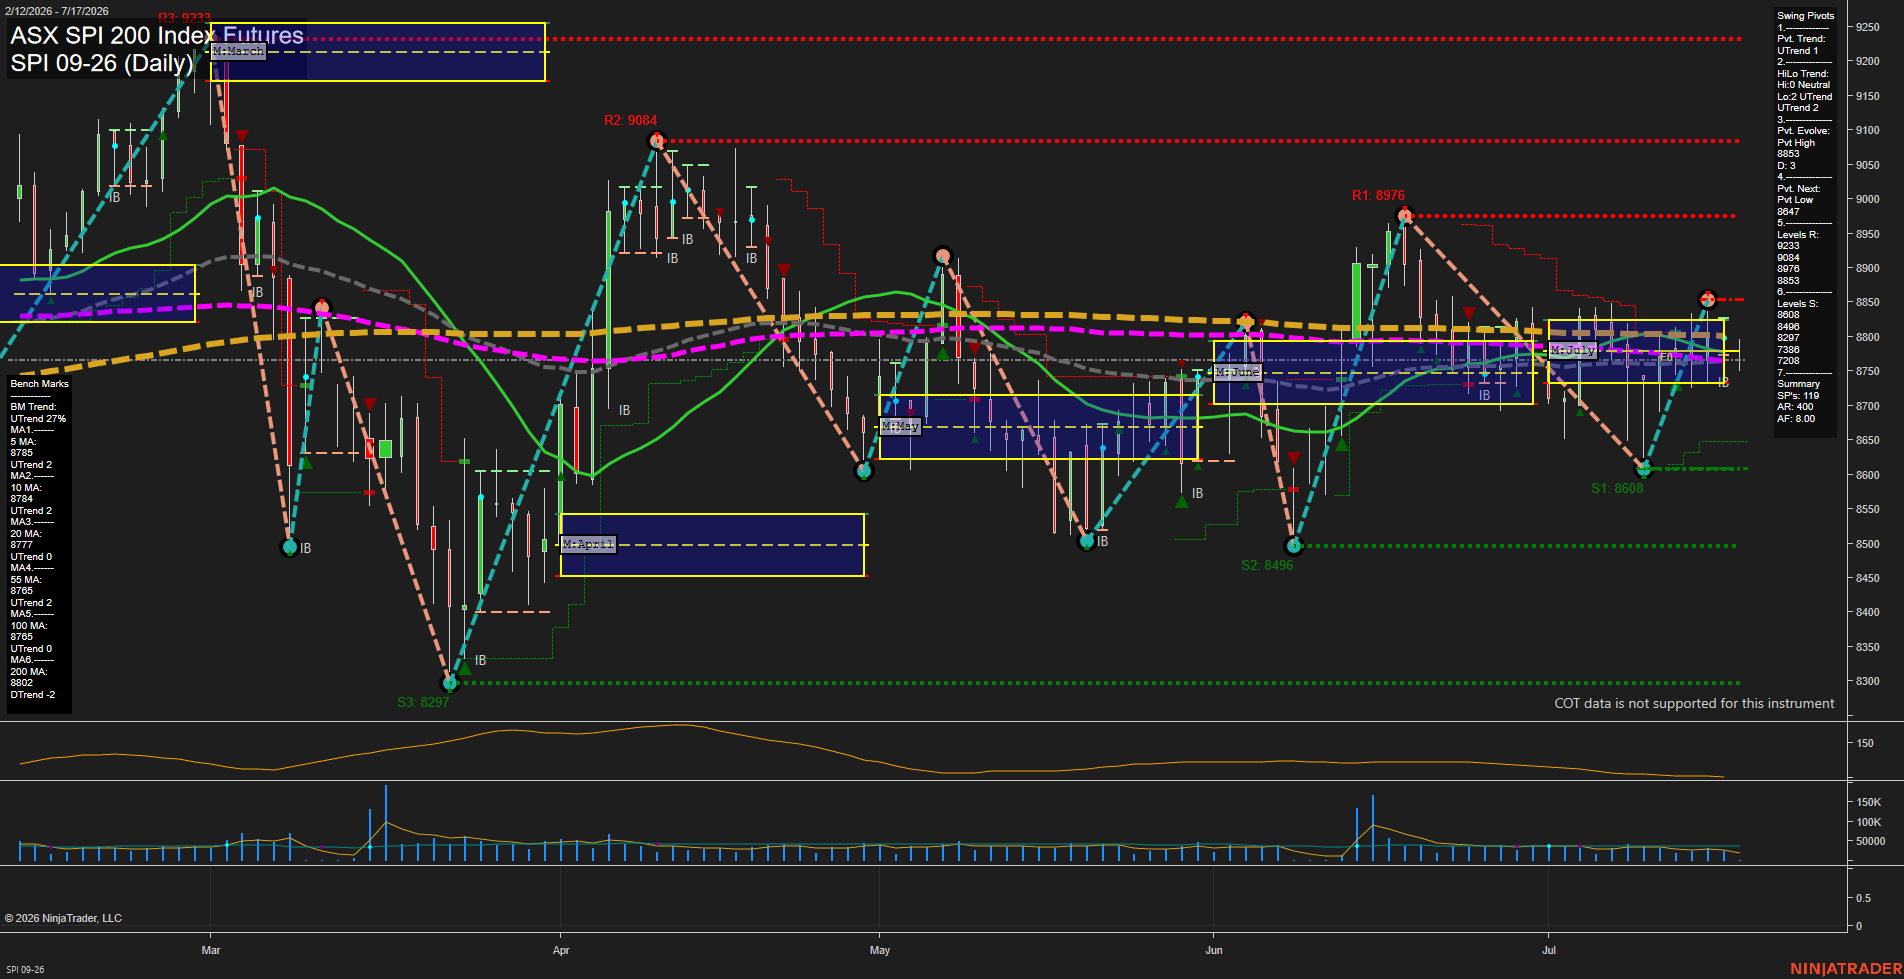
SPI ASX SPI 200 Index Futures Daily Chart Analysis: 2026-Jul-16 07:08 CT
Price Action
- Last: 8784,
- Bars: Medium,
- Mom: average.
WSFG Weekly
- Short-Term
- WSFG Current: NA%
- F0%/NTZ' Bias: Price Neutral,
- WSFG Trend: Neutral.
MSFG Month Jul
- Intermediate-Term
- MSFG Current: NA%
- F0%/NTZ' Bias: Price Neutral,
- MSFG Trend: Neutral.
YSFG Year 2026
- Long-Term
- YSFG Current: NA%
- F0%/NTZ' Bias: Price Neutral,
- YSFG Trend: Neutral.
Swing Pivots
- (Short-Term) 1. Pvt. Trend: UTrend,
- (Intermediate-Term) 2. HiLo Trend: UTrend,
- 3. Pvt. Evolve: Pvt high 8853,
- 4. Pvt. Next: Pvt low 8647,
- 5. Levels R: 9233, 9084, 8976, 8853,
- 6. Levels S: 8608, 8496, 8297, 7386, 7208.
Daily Benchmarks
- (Short-Term) 5 Day: 8753 Up Trend,
- (Short-Term) 10 Day: 8784 Up Trend,
- (Intermediate-Term) 20 Day: 8777 Up Trend,
- (Intermediate-Term) 55 Day: 8765 Down Trend,
- (Long-Term) 100 Day: 8765 Up Trend,
- (Long-Term) 200 Day: 8802 Down Trend.
Additional Metrics
Overall Rating
- Short-Term: Bullish,
- Intermediate-Term: Neutral,
- Long-Term: Neutral.
Key Insights Summary
SPI has recovered sharply from the 8608 swing low and the short-term pivot structure remains upward, with price holding near the clustered 5, 10, 20, 55, and 100-day benchmarks. The 8853 pivot high is the immediate overhead reference, followed by 8976, while 8608 remains the principal nearby swing support. Intermediate structure is mixed as the market consolidates around the July monthly grid and the 55-day average remains down. Longer-term conditions are balanced: the 100-day average is rising, but price remains beneath the declining 200-day average at 8802. ATR compression and lighter volume relative to earlier spikes characterize the current recovery as a consolidation-and-retest phase rather than a broad volatility expansion.
Chart Analysis ATS AI Generated: 2026-07-16 07:08 for Informational use only, not trading advice. Terms and Risk Disclosure Copyright © 2026. Algo Trading Systems LLC.