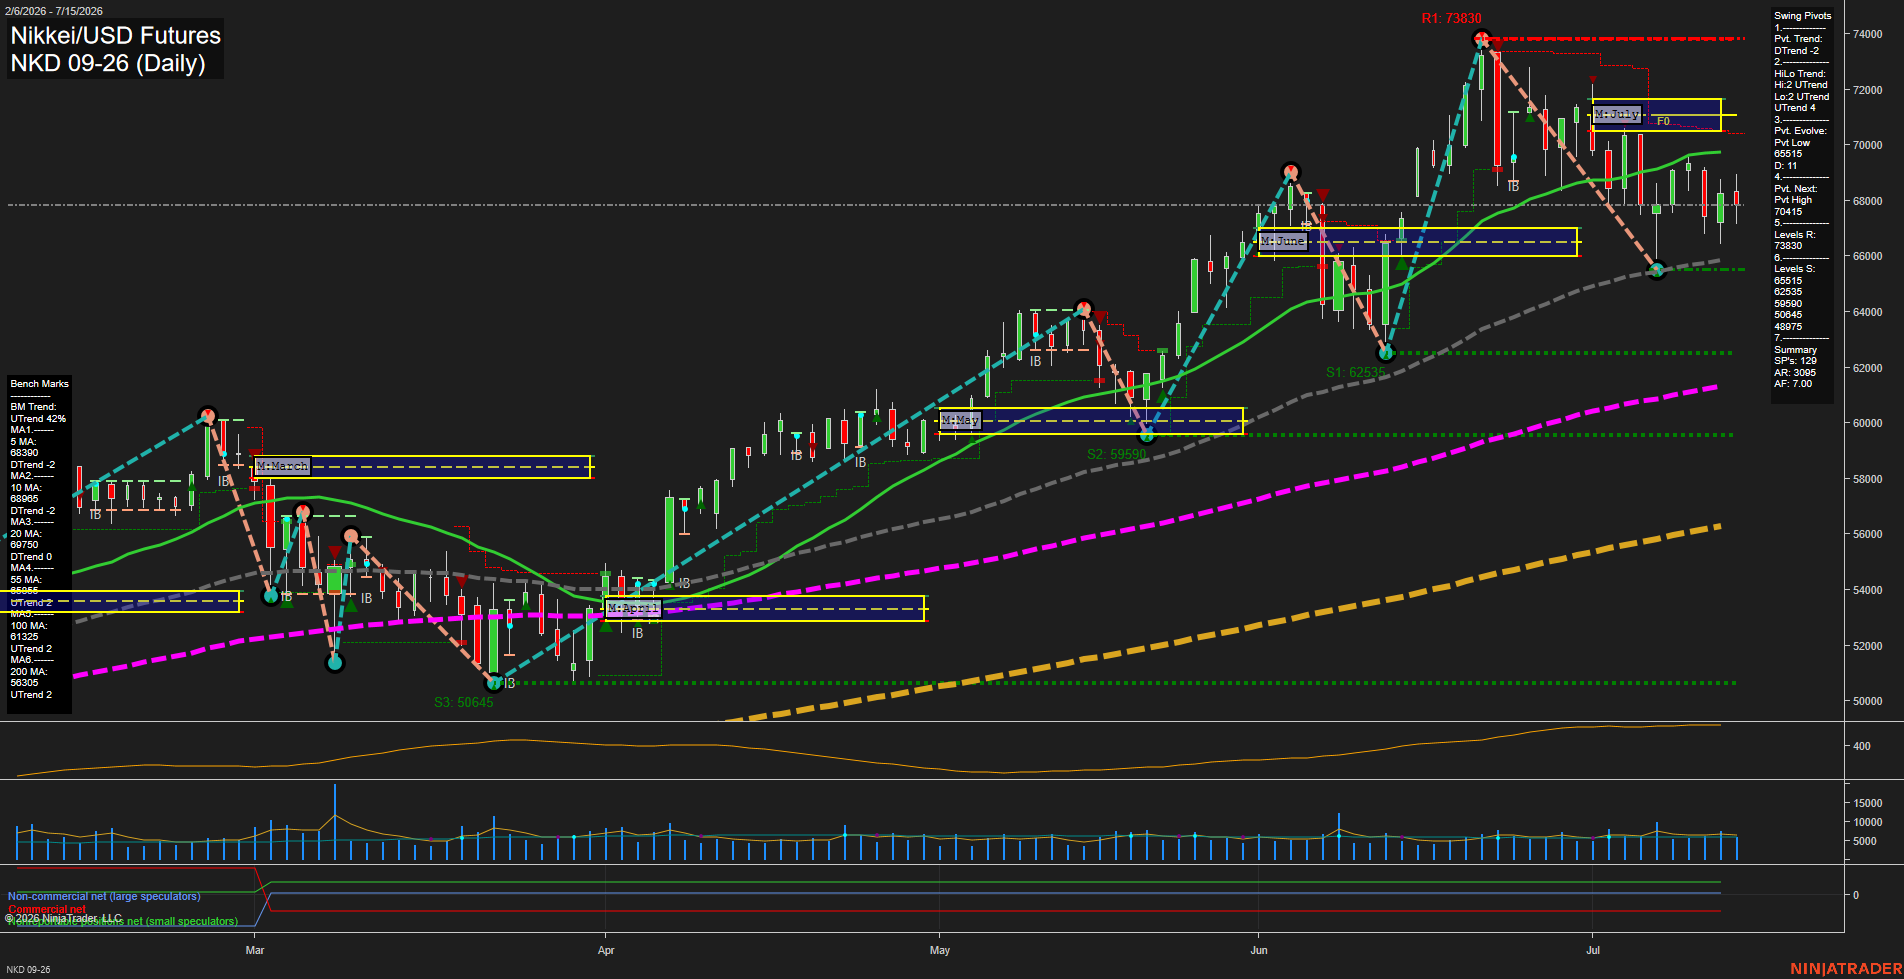
NKD Nikkei/USD Futures Daily Chart Analysis: 2026-Jul-16 07:05 CT
Price Action
- Last: 68100,
- Bars: Medium,
- Mom: slow.
WSFG Weekly
- Short-Term
- WSFG Current: -57%
- F0%/NTZ' Bias: Price Below,
- WSFG Trend: Down.
MSFG Month Jul
- Intermediate-Term
- MSFG Current: -53%
- F0%/NTZ' Bias: Price Below,
- MSFG Trend: Down.
YSFG Year 2026
- Long-Term
- YSFG Current: 185%
- F0%/NTZ' Bias: Price Above,
- YSFG Trend: Up.
Swing Pivots
- (Short-Term) 1. Pvt. Trend: DTrend,
- (Intermediate-Term) 2. HiLo Trend: UTrend,
- 3. Pvt. Evolve: Pvt low 65515,
- 4. Pvt. Next: Pvt high 70415,
- 5. Levels R: 73830,
- 6. Levels S: 65515, 62535, 59590, 50845, 48975.
Daily Benchmarks
- (Short-Term) 5 Day: 68390 Up Trend,
- (Short-Term) 10 Day: 68985 Down Trend,
- (Intermediate-Term) 20 Day: 69757 Down Trend,
- (Intermediate-Term) 55 Day: 65055 Up Trend,
- (Long-Term) 100 Day: 61321 Up Trend,
- (Long-Term) 200 Day: 56305 Up Trend.
Additional Metrics
Recent Trade Signals
- 15 Jul 2026: Long NKD 09-26 @ 68785 Signals.USAR.TR120
- 13 Jul 2026: Short NKD 09-26 @ 68150 Signals.USAR-WSFG
Overall Rating
- Short-Term: Bearish,
- Intermediate-Term: Neutral,
- Long-Term: Bullish.
Key Insights Summary
Price is consolidating below the July monthly and weekly Fib-grid centers, with the short-term pivot structure in a DTrend and price beneath the 5, 10, and 20 day benchmarks. The broader pivot sequence remains constructive, however, as the intermediate HiLo trend is UTrend and price holds above the rising 55, 100, and 200 day benchmarks. The chart reflects a post-rally pullback and sideways compression beneath 70415 pivot resistance, while 65515 is the primary nearby swing support separating the current consolidation from a deeper retracement.
Chart Analysis ATS AI Generated: 2026-07-16 07:06 for Informational use only, not trading advice. Terms and Risk Disclosure Copyright © 2026. Algo Trading Systems LLC.