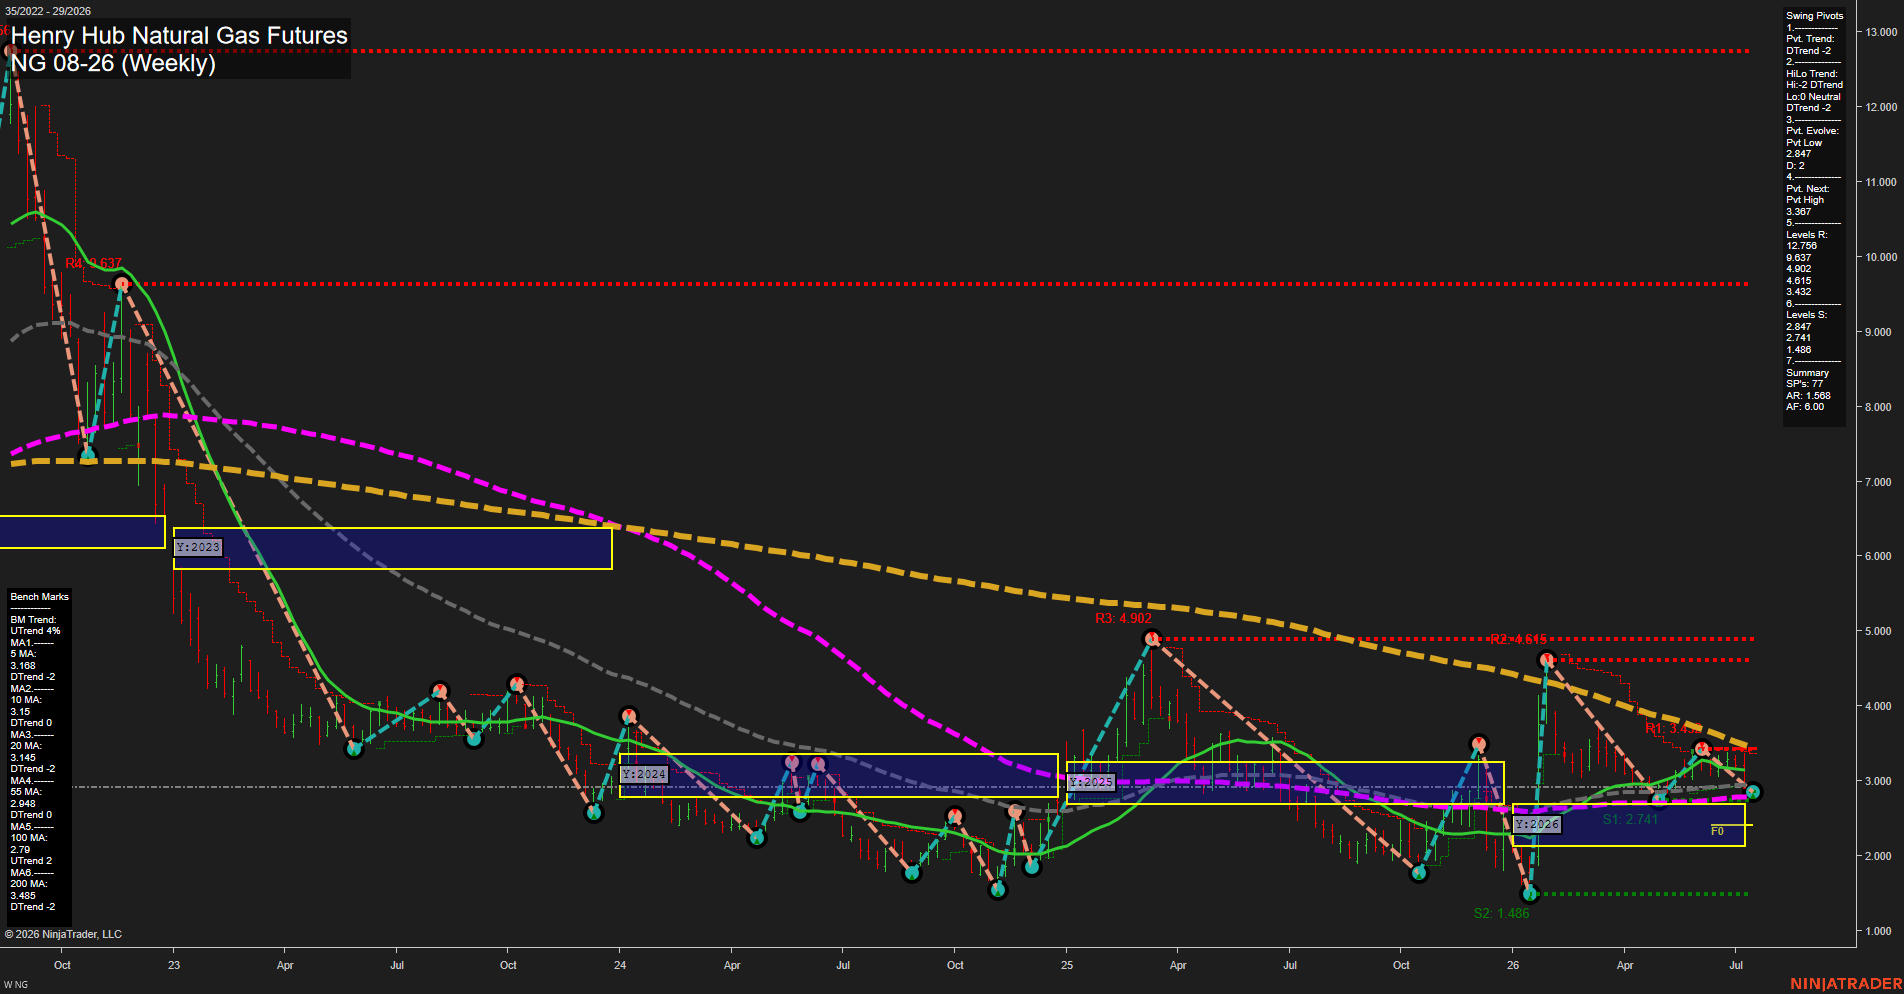
NG Henry Hub Natural Gas Futures Weekly Chart Analysis: 2026-Jul-16 07:05 CT
Price Action
- Last: 2.847,
- Bars: Small,
- Mom: Slow.
WSFG Weekly
- Short-Term
- WSFG Current: -4%
- F0%/NTZ' Bias: Price Below,
- WSFG Trend: Down.
MSFG Month Jul
- Intermediate-Term
- MSFG Current: -72%
- F0%/NTZ' Bias: Price Below,
- MSFG Trend: Down.
YSFG Year 2026
- Long-Term
- YSFG Current: 18%
- F0%/NTZ' Bias: Price Above,
- YSFG Trend: Up.
Swing Pivots
- (Short-Term) 1. Pvt. Trend: DTrend,
- (Intermediate-Term) 2. HiLo Trend: DTrend,
- 3. Pvt. Evolve: Pvt low 2.847,
- 4. Pvt. Next: Pvt high 3.367,
- 5. Levels R: 12.758, 9.637, 4.902, 4.215, 3.432,
- 6. Levels S: 2.847, 2.741, 1.486.
Weekly Benchmarks
- (Short-Term) 5 Day: 3.169 Down Trend,
- (Short-Term) 10 Day: 3.150 Down Trend,
- (Intermediate-Term) 20 Day: 3.195 Down Trend,
- (Intermediate-Term) 55 Day: 2.948 Down Trend,
- (Long-Term) 100 Day: 2.790 Up Trend,
- (Long-Term) 200 Day: 3.485 Down Trend.
Recent Trade Signals
- 14 Jul 2026: Short NG 08-26 @ 2.867 Signals.USAR-WSFG
- 09 Jul 2026: Short NG 08-26 @ 3.03 Signals.USAR.TR720
- 09 Jul 2026: Short NG 08-26 @ 3.203 Signals.USAR-MSFG
Overall Rating
- Short-Term: Bearish,
- Intermediate-Term: Bearish,
- Long-Term: Neutral.
Key Insights Summary
Price is consolidating near the 2.847 pivot-low support after a sharp first-quarter recovery failed below the 3.432 pivot resistance area. Short- and intermediate-term structure remains bearish: price is below the 5, 10, 20, and 55 week benchmarks, while both pivot trend measures remain in DTrend. The 2.741 support is the nearby secondary floor, with 1.486 the major lower pivot reference. The yearly grid remains positive and the 100 week benchmark is rising, creating a neutral longer-term backdrop beneath the dominant weekly and monthly downtrend.
Chart Analysis ATS AI Generated: 2026-07-16 07:05 for Informational use only, not trading advice. Terms and Risk Disclosure Copyright © 2026. Algo Trading Systems LLC.