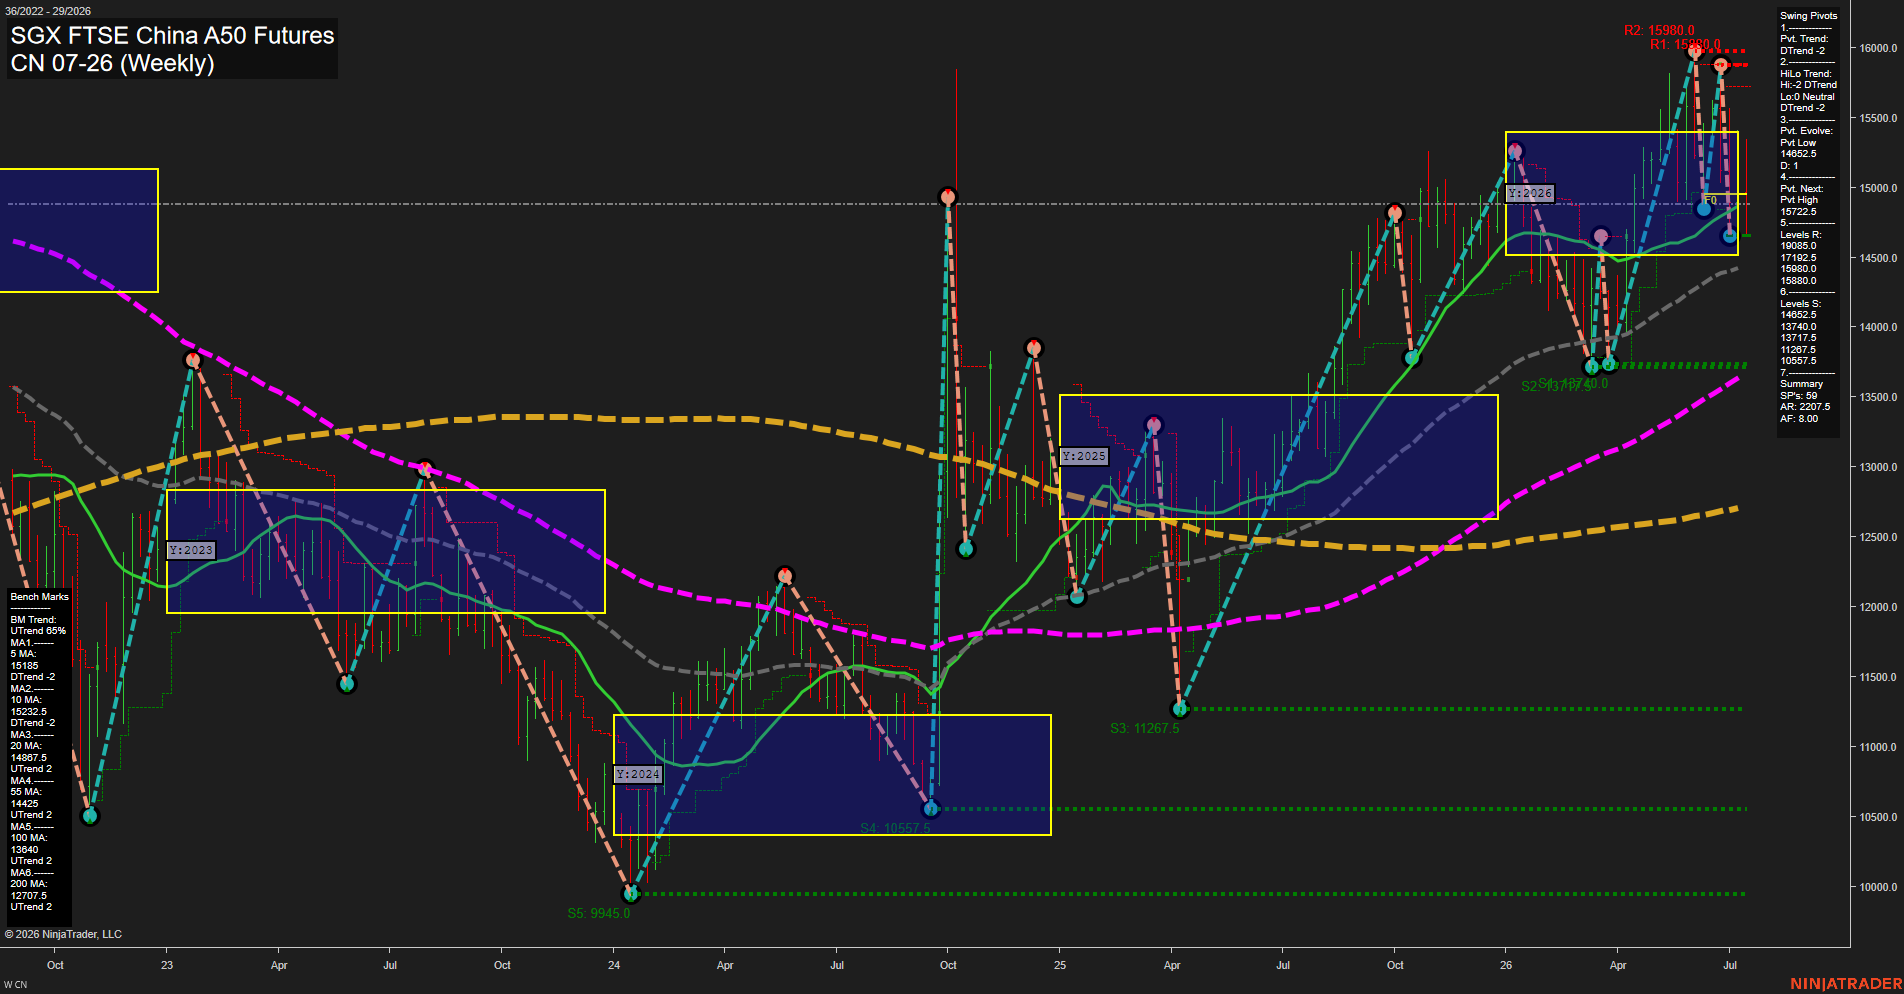
CN SGX FTSE China A50 Futures Weekly Chart Analysis: 2026-Jul-16 07:02 CT
Price Action
- Last: 14722.5,
- Bars: Large,
- Mom: Fast.
WSFG Weekly
- Short-Term
- WSFG Current: NA%
- F0%/NTZ' Bias: Price Neutral,
- WSFG Trend: Neutral.
MSFG Month Jul
- Intermediate-Term
- MSFG Current: NA%
- F0%/NTZ' Bias: Price Neutral,
- MSFG Trend: Neutral.
YSFG Year 2026
- Long-Term
- YSFG Current: 42%
- F0%/NTZ' Bias: Price Neutral,
- YSFG Trend: Neutral.
Swing Pivots
- (Short-Term) 1. Pvt. Trend: DTrend,
- (Intermediate-Term) 2. HiLo Trend: DTrend,
- 3. Pvt. Evolve: Pvt low 14652.5,
- 4. Pvt. Next: Pvt high 15722.5,
- 5. Levels R: 15985.0, 15980.0, 15880.0, 15192.5,
- 6. Levels S: 14652.5, 13740.0, 13717.5, 11267.5, 10557.5, 9945.0.
Weekly Benchmarks
- (Short-Term) 5 Day: 15185.0 Down Trend,
- (Short-Term) 10 Day: 15232.5 Down Trend,
- (Intermediate-Term) 20 Day: 14867.5 Up Trend,
- (Intermediate-Term) 55 Day: 14425.0 Up Trend,
- (Long-Term) 100 Day: 13640.0 Up Trend,
- (Long-Term) 200 Day: 12707.5 Up Trend.
Overall Rating
- Short-Term: Bearish,
- Intermediate-Term: Neutral,
- Long-Term: Bullish.
Key Insights Summary
Price has experienced a sharp, high-volatility pullback from the 15980.0 area and remains beneath the declining 5- and 10-week benchmarks, confirming short-term bearish swing pressure. The active pivot structure is DTrend, although the 14652.5 pivot-low area is currently defining the immediate downside reference. Intermediate structure is mixed: price is below the rising 20-week average but remains above the rising 55-week average, reflecting a retracement within a broader recovery phase. Long-term conditions remain constructive as price holds well above the rising 100- and 200-week benchmarks. The yearly grid places price within its neutral zone and below its central balance area, while 15192.5 through 15985.0 defines the overhead resistance cluster.
Chart Analysis ATS AI Generated: 2026-07-16 07:03 for Informational use only, not trading advice. Terms and Risk Disclosure Copyright © 2026. Algo Trading Systems LLC.