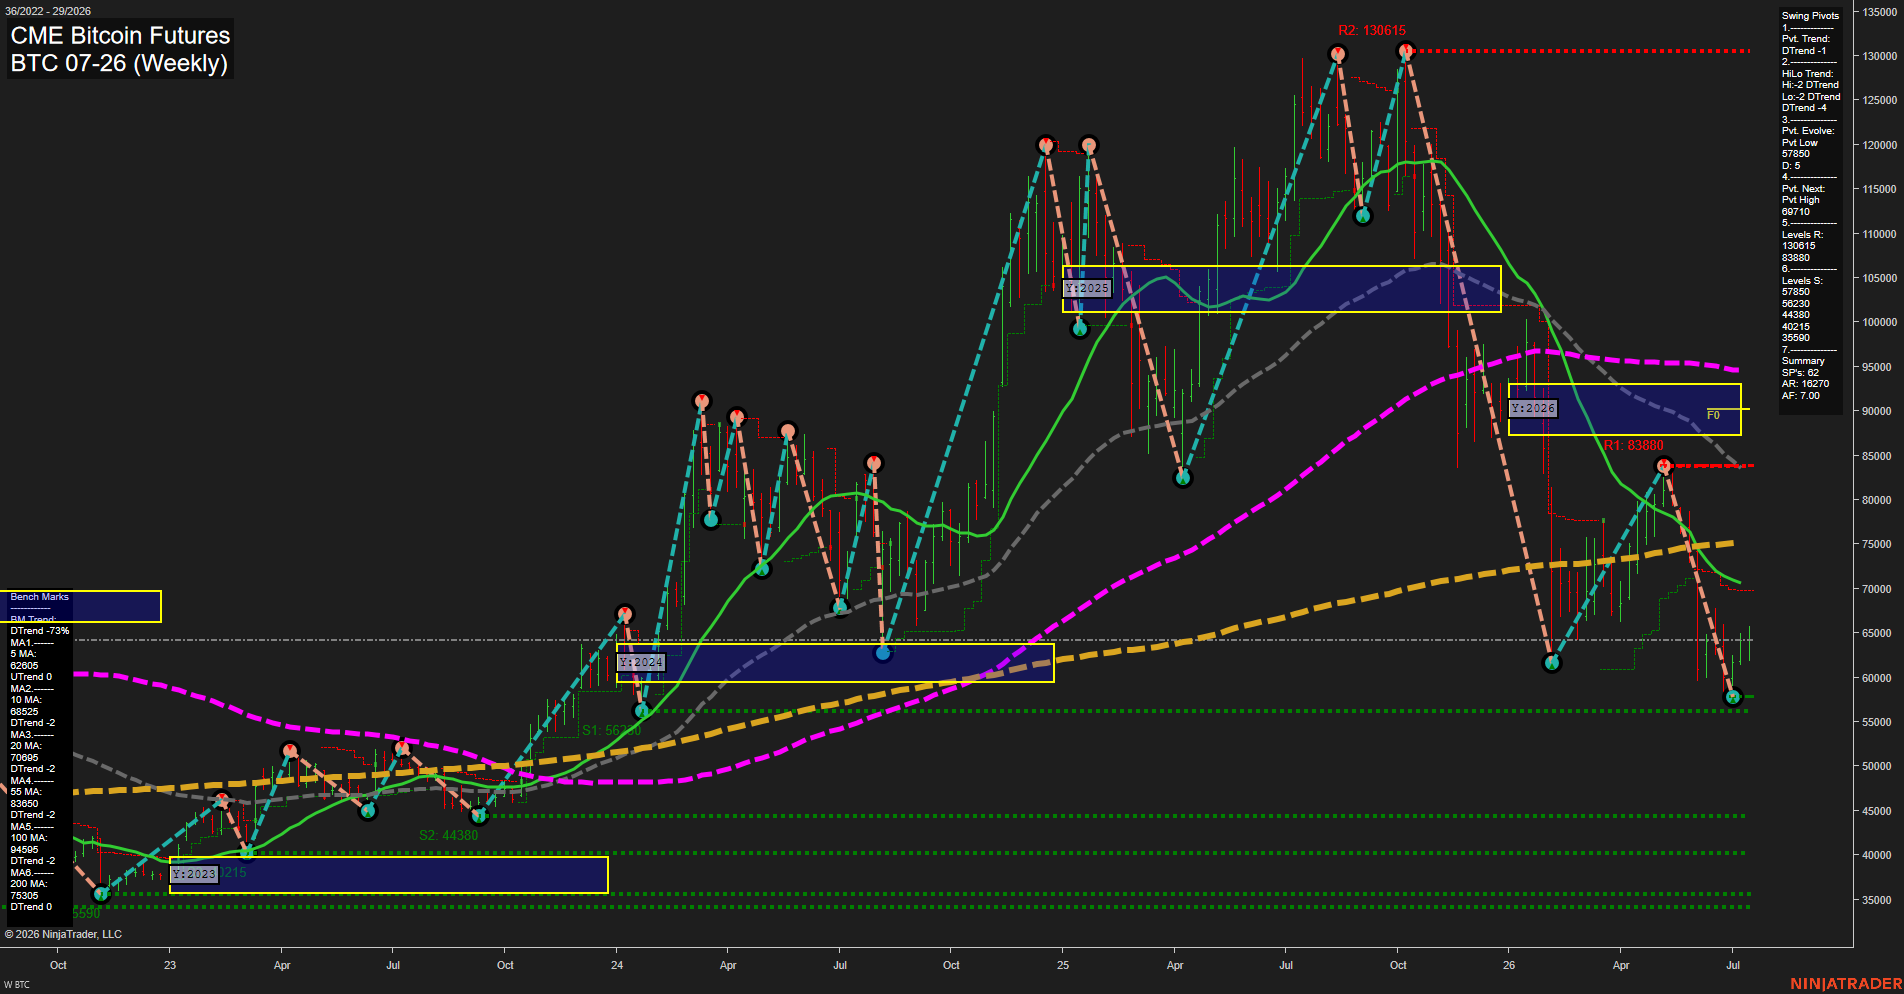
BTC CME Bitcoin Futures Weekly Chart Analysis: 2026-Jul-16 07:01 CT
Price Action
- Last: 62600,
- Bars: Small,
- Mom: Momentum slow.
WSFG Weekly
- Short-Term
- WSFG Current: 4%
- F0%/NTZ' Bias: Price Above,
- WSFG Trend: Up.
MSFG Month Jul
- Intermediate-Term
- MSFG Current: 40%
- F0%/NTZ' Bias: Price Above,
- MSFG Trend: Up.
YSFG Year 2026
- Long-Term
- YSFG Current: -90%
- F0%/NTZ' Bias: Price Below,
- YSFG Trend: Down.
Swing Pivots
- (Short-Term) 1. Pvt. Trend: DTrend,
- (Intermediate-Term) 2. HiLo Trend: DTrend,
- 3. Pvt. Evolve: Pvt low 57850,
- 4. Pvt. Next: Pvt high 69710,
- 5. Levels R: 130615, 83880,
- 6. Levels S: 57850, 56230, 44830, 40215, 35590.
Weekly Benchmarks
- (Short-Term) 5 Day: 62600 Down Trend,
- (Short-Term) 10 Day: 68525 Down Trend,
- (Intermediate-Term) 20 Day: 70696 Down Trend,
- (Intermediate-Term) 55 Day: 83650 Down Trend,
- (Long-Term) 100 Day: 94595 Down Trend,
- (Long-Term) 200 Day: 75300 Down Trend.
Recent Trade Signals
- 16 Jul 2026: Long BTC 07-26 @ 64725 Signals.USAR-WSFG
- 14 Jul 2026: Long BTC 07-26 @ 64945 Signals.USAR.TR120
Overall Rating
- Short-Term: Bearish,
- Intermediate-Term: Bearish,
- Long-Term: Bearish.
Key Insights Summary
Weekly price action is consolidating with small bars near 62600 after a steep decline from the 83880 pivot resistance area. The short-term WSFG and monthly MSFG remain positive, but the active pivot structure is DTrend and price remains beneath the 10, 20, 55, 100, and 200 Day benchmarks. The 57850 pivot low is the immediate structural reference, while 69710 is the reversal threshold for a new pivot high. The broader 2026 YSFG remains below F0% and the benchmark alignment remains decisively downward, defining the current recovery attempt as a counter-trend bounce within a longer-term bearish cycle.
Chart Analysis ATS AI Generated: 2026-07-16 07:02 for Informational use only, not trading advice. Terms and Risk Disclosure Copyright © 2026. Algo Trading Systems LLC.