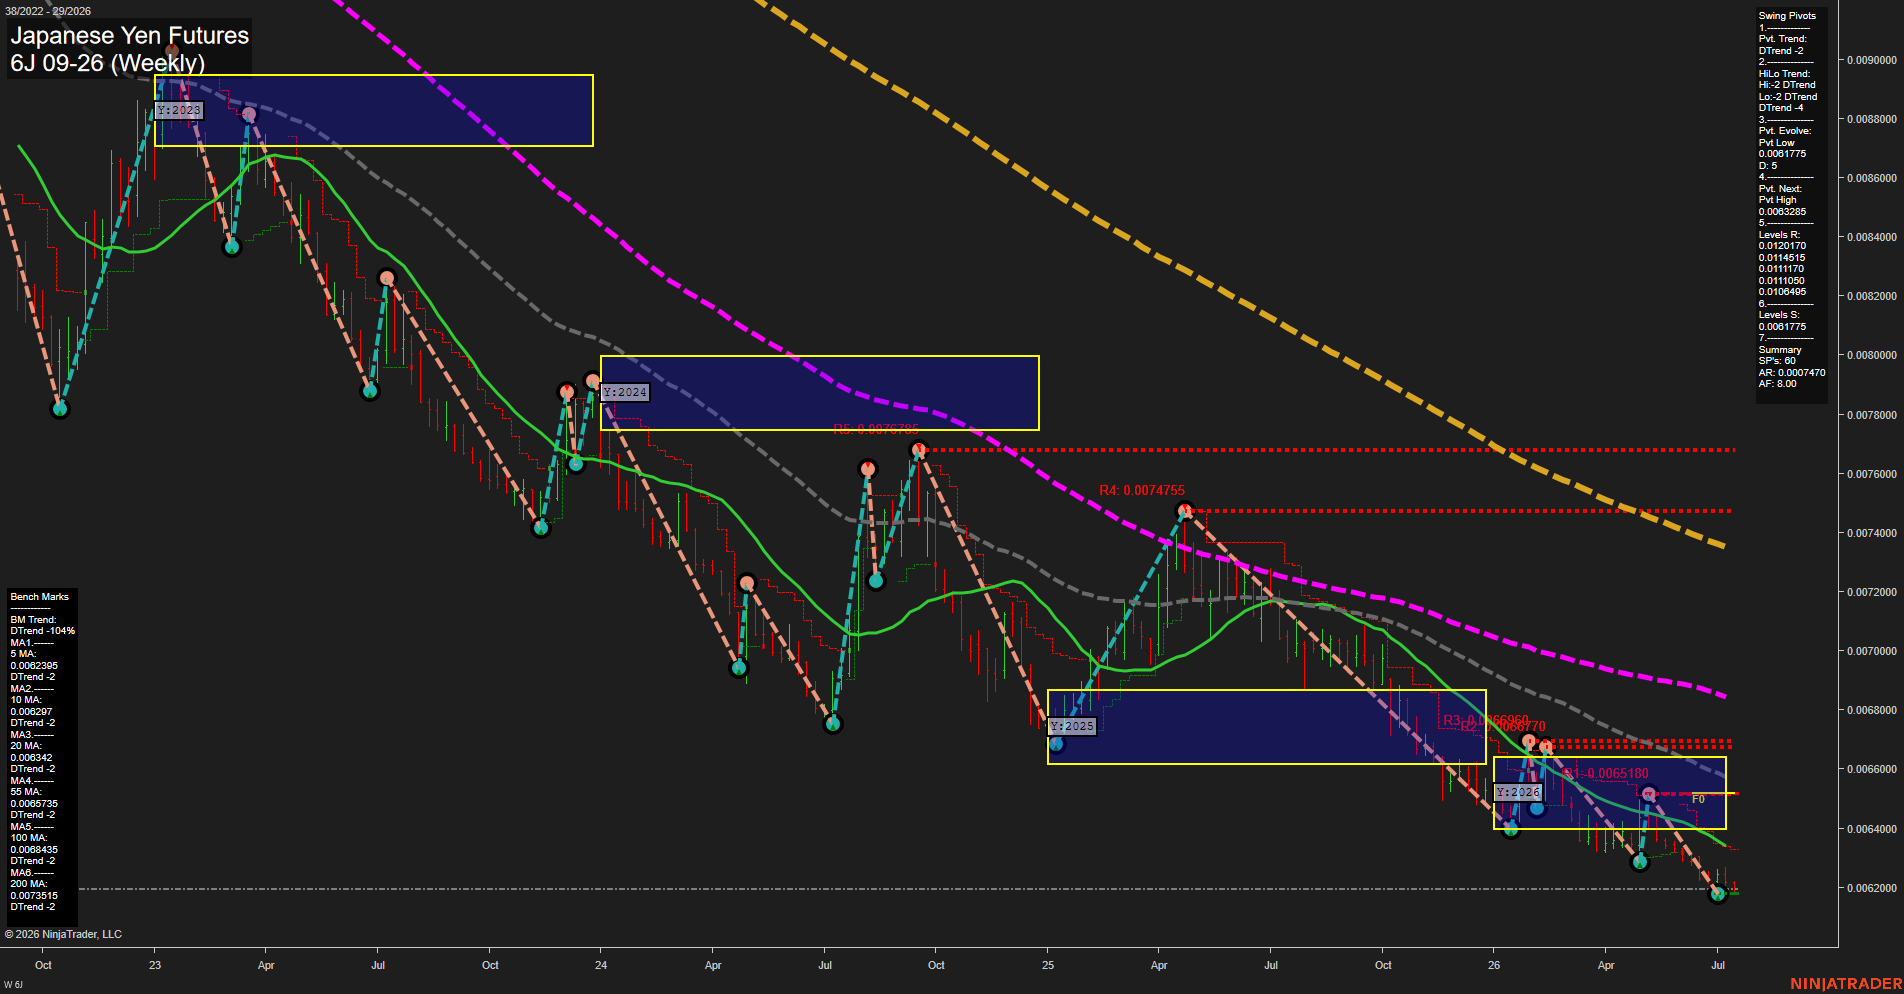
6J Japanese Yen Futures Weekly Chart Analysis: 2026-Jul-16 07:01 CT
Price Action
- Last: 0.006194,
- Bars: Small,
- Mom: slow.
WSFG Weekly
- Short-Term
- WSFG Current: -32%
- F0%/NTZ' Bias: Price Below,
- WSFG Trend: Down.
MSFG Month Jul
- Intermediate-Term
- MSFG Current: 9%
- F0%/NTZ' Bias: Price Above,
- MSFG Trend: Up.
YSFG Year 2026
- Long-Term
- YSFG Current: -27%
- F0%/NTZ' Bias: Price Below,
- YSFG Trend: Down.
Swing Pivots
- (Short-Term) 1. Pvt. Trend: DTrend,
- (Intermediate-Term) 2. HiLo Trend: DTrend,
- 3. Pvt. Evolve: Pvt low 0.0061775,
- 4. Pvt. Next: Pvt high 0.0063285,
- 5. Levels R: 0.0120170, 0.0114515, 0.0111170, 0.0110050, 0.0106495,
- 6. Levels S: 0.0061775.
Weekly Benchmarks
- (Short-Term) 5 Day: 0.0062395 Down Trend,
- (Short-Term) 10 Day: 0.0062297 Down Trend,
- (Intermediate-Term) 20 Day: 0.0064342 Down Trend,
- (Intermediate-Term) 55 Day: 0.0065735 Down Trend,
- (Long-Term) 100 Day: 0.0068435 Down Trend,
- (Long-Term) 200 Day: 0.0073515 Down Trend.
Recent Trade Signals
- 13 Jul 2026: Short 6J 09-26 @ 0.006194 Signals.USAR.TR120
- 13 Jul 2026: Long 6J 09-26 @ 0.006208 Signals.USAR-MSFG
Overall Rating
- Short-Term: Bearish,
- Intermediate-Term: Bearish,
- Long-Term: Bearish.
Key Insights Summary
The weekly structure remains broadly bearish, with price pressing near the 0.0061775 pivot-low support while all six benchmarks slope lower and remain above the market. The monthly fib position is modestly positive, indicating a counter-trend recovery attempt within the larger decline, but the weekly and yearly grids remain below their F0% levels. Small weekly bars and slow momentum reflect compression near the lows rather than a confirmed reversal. A pivot-high evolution above 0.0063285 would alter the immediate swing structure; until then, the chart retains lower-high and lower-low characteristics.
Chart Analysis ATS AI Generated: 2026-07-16 07:01 for Informational use only, not trading advice. Terms and Risk Disclosure Copyright © 2026. Algo Trading Systems LLC.