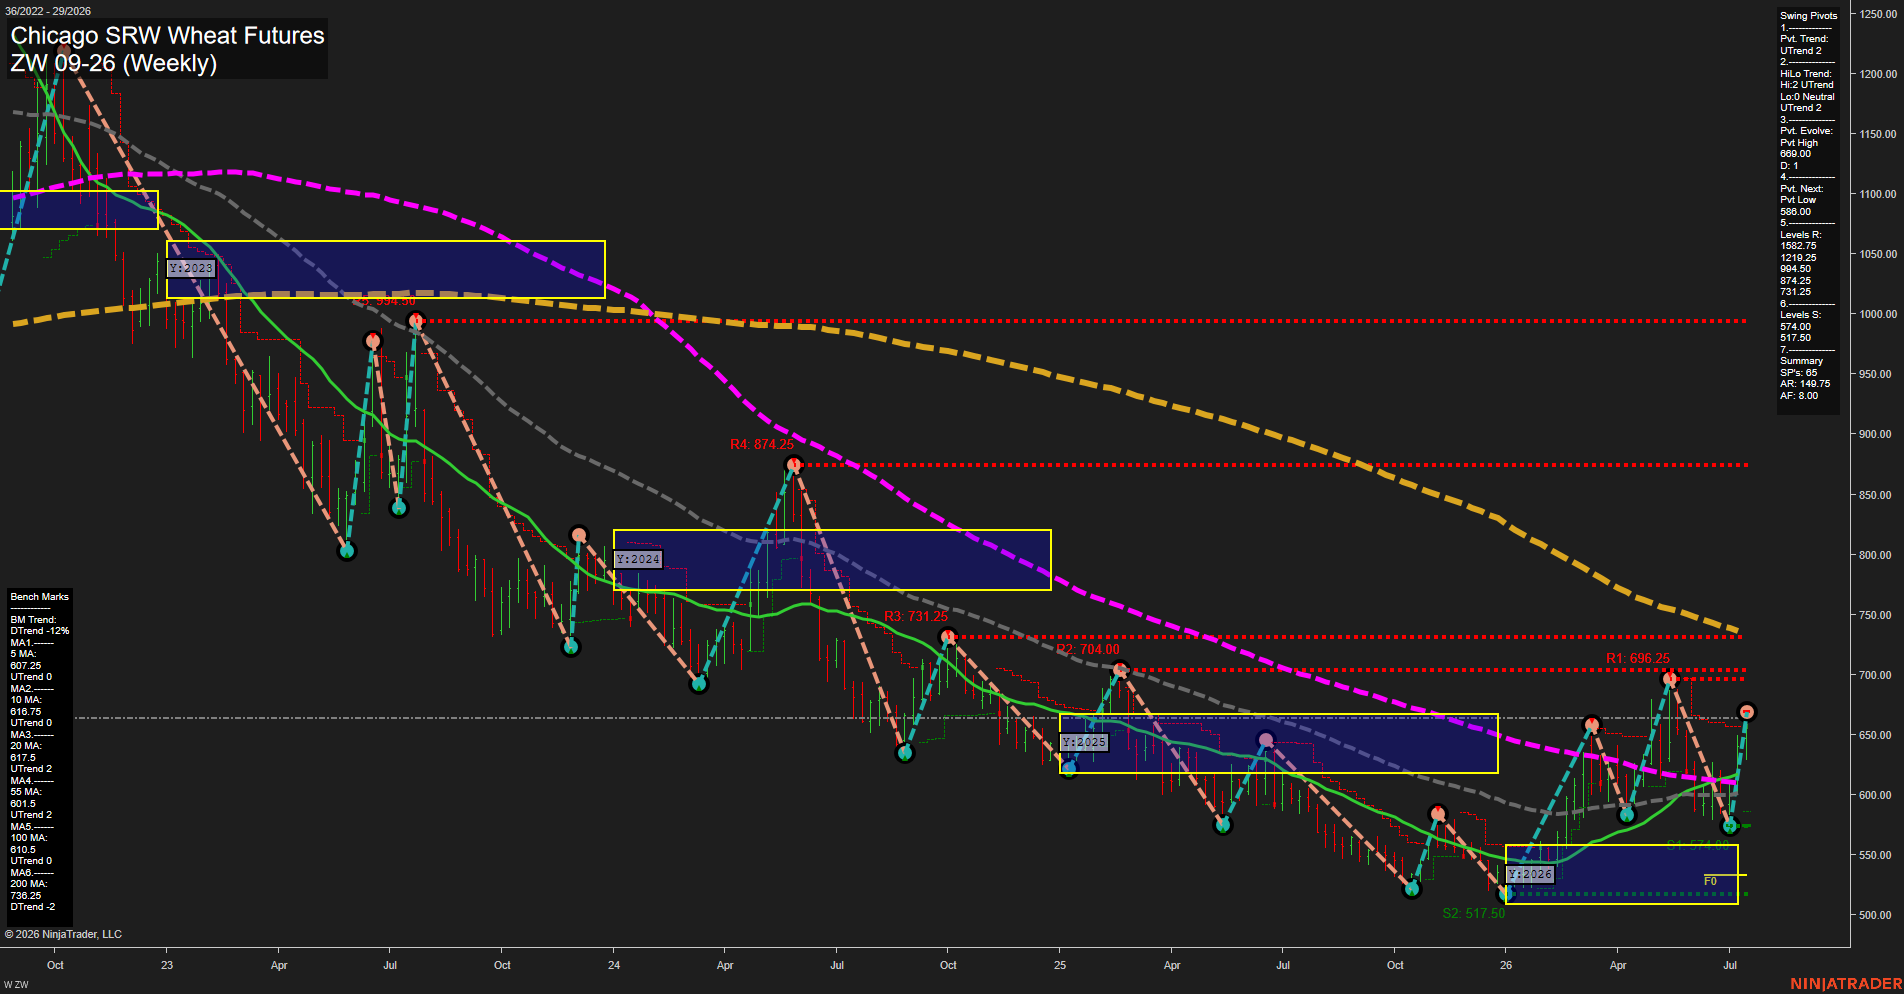
ZW Chicago SRW Wheat Futures Weekly Chart Analysis: 2026-Jul-15 07:09 CT
Price Action
- Last: 669.00,
- Bars: Large,
- Mom: fast.
WSFG Weekly
- Short-Term
- WSFG Current: 44%
- F0%/NTZ' Bias: Price Above,
- WSFG Trend: Up.
MSFG Month Jul
- Intermediate-Term
- MSFG Current: 95%
- F0%/NTZ' Bias: Price Above,
- MSFG Trend: Up.
YSFG Year 2026
- Long-Term
- YSFG Current: 54%
- F0%/NTZ' Bias: Price Above,
- YSFG Trend: Up.
Swing Pivots
- (Short-Term) 1. Pvt. Trend: UTrend,
- (Intermediate-Term) 2. HiLo Trend: UTrend,
- 3. Pvt. Evolve: Pvt High 689.00,
- 4. Pvt. Next: Pvt Low 658.00,
- 5. Levels R: 1582.75, 1219.25, 994.50, 874.25, 731.25,
- 6. Levels S: 574.00, 517.50.
Weekly Benchmarks
- (Short-Term) 5 Day: 607.25 Up Trend,
- (Short-Term) 10 Day: 616.75 Up Trend,
- (Intermediate-Term) 20 Day: 617.50 Up Trend,
- (Intermediate-Term) 55 Day: 601.50 Up Trend,
- (Long-Term) 100 Day: 610.50 Up Trend,
- (Long-Term) 200 Day: 738.25 Down Trend.
Recent Trade Signals
- 10 Jul 2026: Long ZW 09-26 @ 614.5 Signals.USAR-MSFG
- 07 Jul 2026: Long ZW 09-26 @ 614.75 Signals.USAR.TR720
Overall Rating
- Short-Term: Bullish,
- Intermediate-Term: Bullish,
- Long-Term: Neutral.
Key Insights Summary
Wheat remains in a broad multi-year decline from the 2022 peak, but the 2026 structure has turned constructive with price recovering from the 517.50 yearly support zone and pressing into the mid-600s. The weekly, monthly, and yearly session fib grids are all holding price above their F0%/NTZ bands, which keeps the trend alignment positive across short, intermediate, and long horizons. Swing pivot structure is also supportive, with both the pivot trend and hi/lo trend in UTrend and the next pivot reference pointing to a lower swing low near 658.00 after the recent high around 689.00. Benchmarks are stacked favorably through the 100-day area, while the 200-day remains overhead and still declining, reflecting a market that has improved sharply but has not fully reversed the larger secular downtrend. Recent long signals confirm the current recovery phase and the chart is behaving like a bullish rally inside a larger recovery/consolidation structure, with higher lows and a strong rebound from the spring 2026 base.
Chart Analysis ATS AI Generated: 2026-07-15 07:09 for Informational use only, not trading advice. Terms and Risk Disclosure Copyright © 2026. Algo Trading Systems LLC.