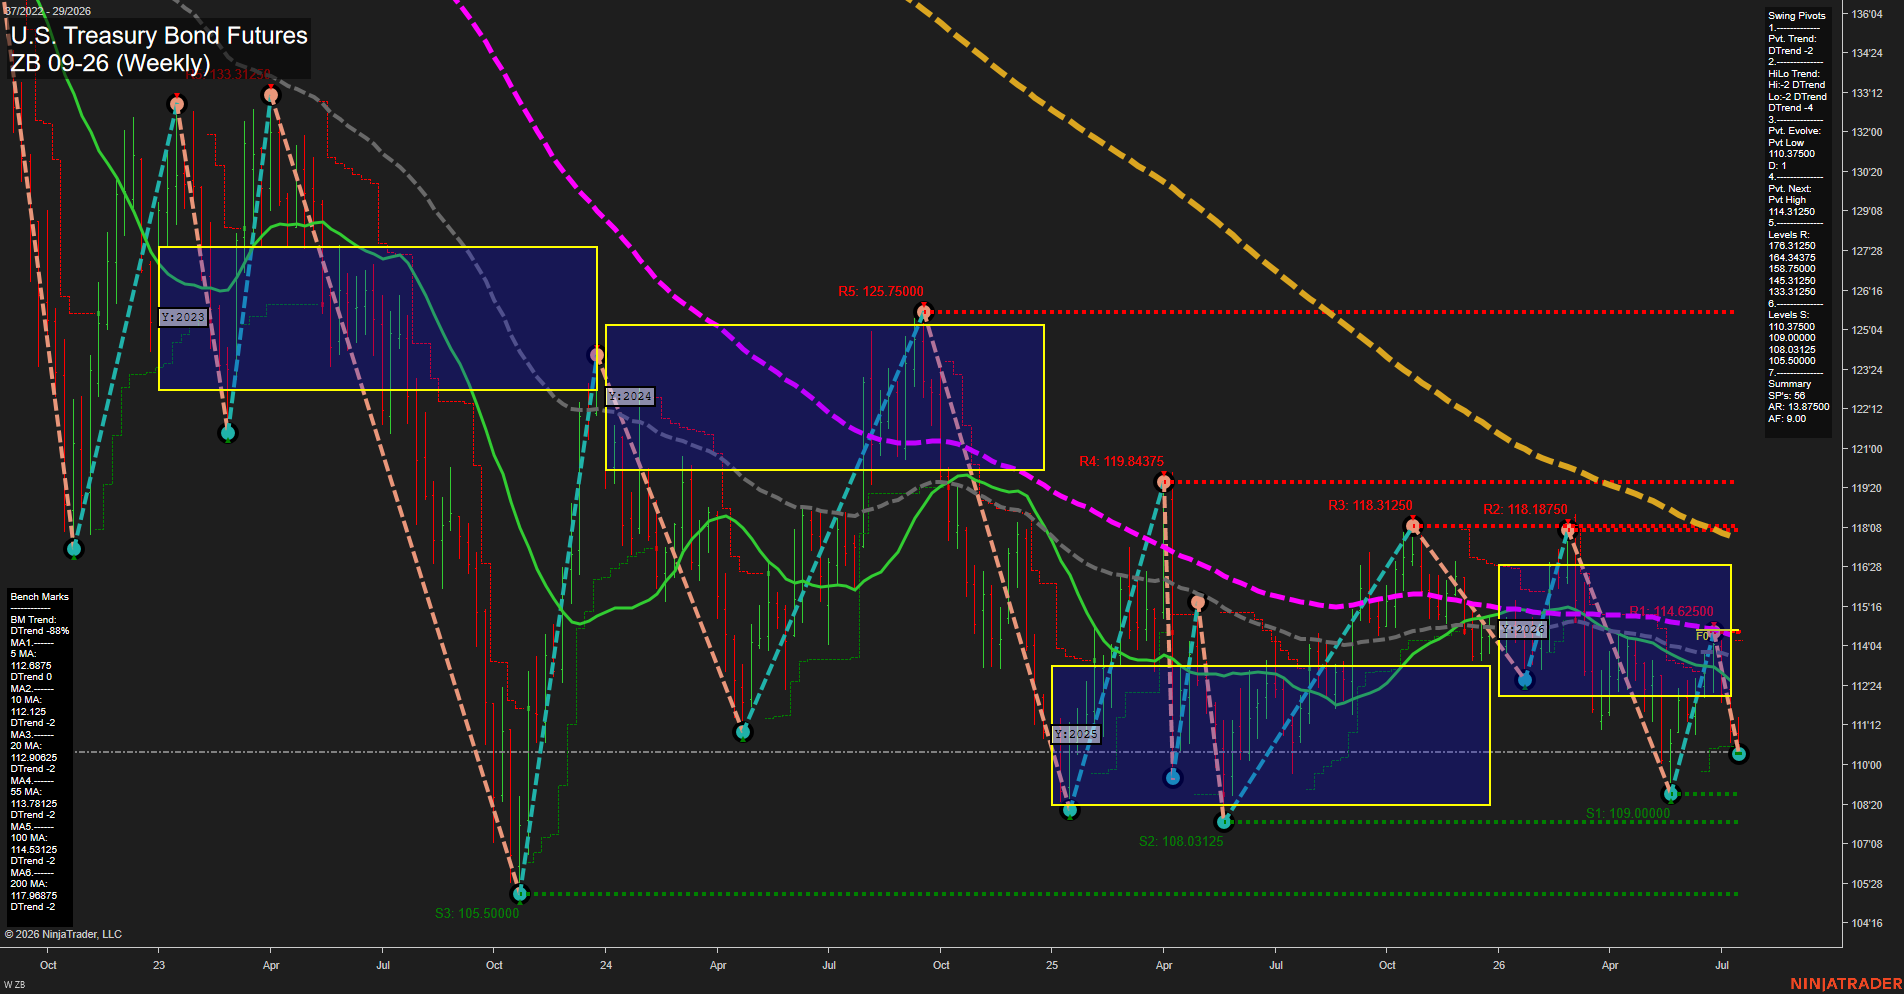
ZB U.S. Treasury Bond Futures Weekly Chart Analysis: 2026-Jul-15 07:08 CT
Price Action
- Last: 114'14.625,
- Bars: Medium,
- Mom: average.
WSFG Weekly
- Short-Term
- WSFG Current: NA%
- F0%/NTZ' Bias: Price Neutral,
- WSFG Trend: Neutral.
MSFG Month Jul
- Intermediate-Term
- MSFG Current: NA%
- F0%/NTZ' Bias: Price Neutral,
- MSFG Trend: Neutral.
YSFG Year 2026
- Long-Term
- YSFG Current: NA%
- F0%/NTZ' Bias: Price Neutral,
- YSFG Trend: Neutral.
Swing Pivots
- (Short-Term) 1. Pvt. Trend: DTrend,
- (Intermediate-Term) 2. HiLo Trend: DTrend,
- 3. Pvt. Evolve: Pvt Low 110'03.750,
- 4. Pvt. Next: Pvt High 114'31.250,
- 5. Levels R: 176'31.250, 164'34.375, 158'75.000, 145'31.250, 133'31.250,
- 6. Levels S: 110'37.500, 109'00.000, 108'03.125, 105'50.000.
Weekly Benchmarks
- (Short-Term) 5 Day: 112'68.750 Down Trend,
- (Short-Term) 10 Day: 112'12.500 Down Trend,
- (Intermediate-Term) 20 Day: 112'90.625 Down Trend,
- (Intermediate-Term) 55 Day: 113'78.125 Down Trend,
- (Long-Term) 100 Day: 114'53.125 Down Trend,
- (Long-Term) 200 Day: 117'96.875 Down Trend.
Overall Rating
- Short-Term: Neutral,
- Intermediate-Term: Bearish,
- Long-Term: Bearish.
Key Insights Summary
Weekly ZB is sitting in a broad rotational structure with the current price near the 2026 YSFG centerline, which keeps the longer-cycle bias balanced at the grid level even as the swing pivot structure remains in a downtrend. The pivot sequence shows a lower-high, lower-low profile on the intermediate swing map, with overhead resistance layered at 114'31.250, 119'84.375, and 125'75.000, while support is stacked at 110'37.500, 109'00.000, 108'03.125, and 105'50.000. The benchmark averages are all sloping lower, and price is clustered around the 100-day area while staying below the 200-day benchmark, reinforcing a bearish longer-term backdrop. From a futures swing trader viewpoint, the chart reflects a mixed near-term state: neutral at the session-grid level, but still compressed under declining trend structure, with recent action looking more like consolidation after a larger decline than a clean trend reversal.
Chart Analysis ATS AI Generated: 2026-07-15 07:08 for Informational use only, not trading advice. Terms and Risk Disclosure Copyright © 2026. Algo Trading Systems LLC.