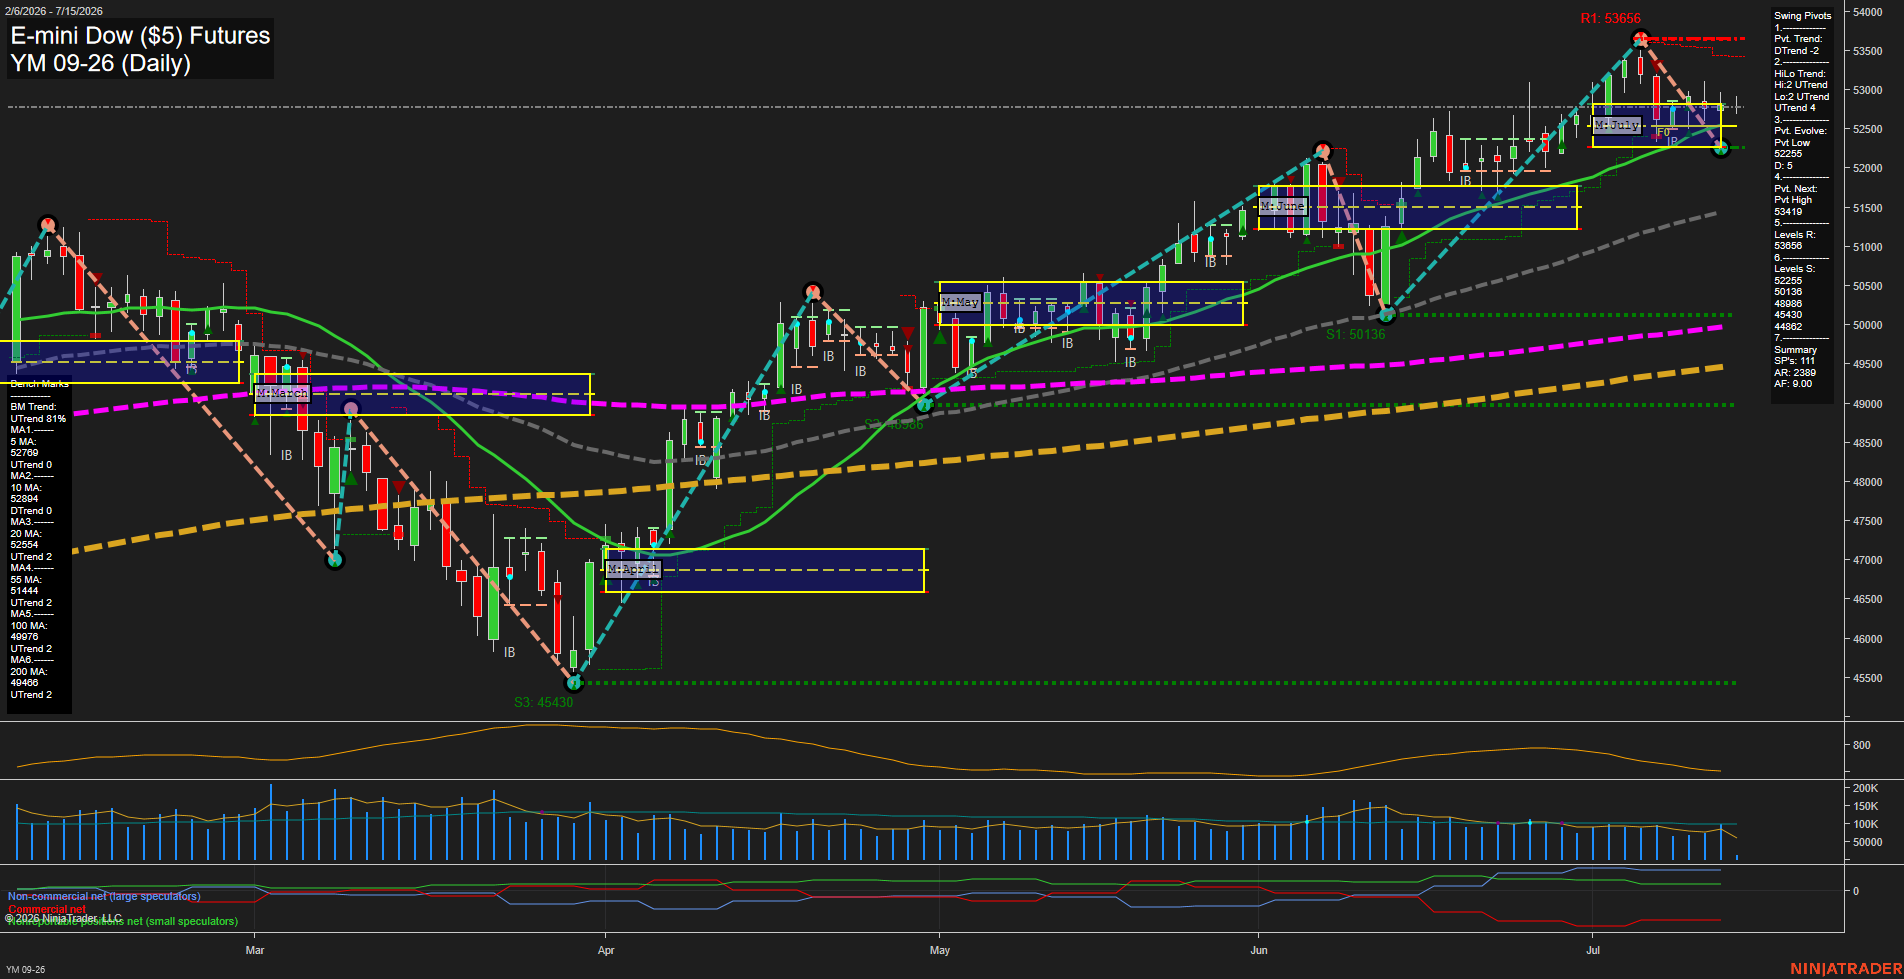
YM E-mini Dow ($5) Futures Daily Chart Analysis: 2026-Jul-15 07:07 CT
Price Action
- Last: 52300,
- Bars: Medium,
- Mom: average.
WSFG Weekly
- Short-Term
- WSFG Current: -3%
- F0%/NTZ' Bias: Price Below,
- WSFG Trend: Down.
MSFG Month Jul
- Intermediate-Term
- MSFG Current: 11%
- F0%/NTZ' Bias: Price Above,
- MSFG Trend: Up.
YSFG Year 2026
- Long-Term
- YSFG Current: 44%
- F0%/NTZ' Bias: Price Above,
- YSFG Trend: Up.
Swing Pivots
- (Short-Term) 1. Pvt. Trend: DTrend,
- (Intermediate-Term) 2. HiLo Trend: UTrend,
- 3. Pvt. Evolve: Pvt Low 52255,
- 4. Pvt. Next: Pvt High 53419,
- 5. Levels R: 53656, 53419,
- 6. Levels S: 52255, 50136, 48986, 45430.
Daily Benchmarks
- (Short-Term) 5 Day: 52769 Down Trend,
- (Short-Term) 10 Day: 52894 Down Trend,
- (Intermediate-Term) 20 Day: 52554 Up Trend,
- (Intermediate-Term) 55 Day: 51444 Up Trend,
- (Long-Term) 100 Day: 49976 Up Trend,
- (Long-Term) 200 Day: 49486 Up Trend.
Additional Metrics
Recent Trade Signals
- 14 Jul 2026: Short YM 09-26 @ 52461 Signals.USAR.TR120
- 14 Jul 2026: Short YM 09-26 @ 52634 Signals.USAR-WSFG
- 13 Jul 2026: Long YM 09-26 @ 52853 Signals.USAR-MSFG
Overall Rating
- Short-Term: Bearish,
- Intermediate-Term: Bullish,
- Long-Term: Bullish.
Key Insights Summary
The daily structure shows a mixed but still constructive swing backdrop: the weekly fib grid remains below its midpoint and points down, while the monthly and yearly fib grids stay above their midlines and trend up, keeping the broader recovery intact. Price is sitting back beneath the short-term 5 and 10 day benchmarks after a sharp push up into the 53.6K area and a pullback toward the 52.2K pivot support zone, which fits a pause within an upward intermediate and long-term cycle rather than a full trend reversal. The swing pivot setup has rolled to DTrend short-term with the next pivot type still a higher high at 53419, while key support is layered at 52255, 50136, 48986, and 45430. Recent signals also reflect this rotation, with short signals triggered against the weekly structure after the prior monthly long setup. Overall, the chart is consolidating after an extended rally, with near-term weakness against a larger bullish monthly-yearly trend.
Chart Analysis ATS AI Generated: 2026-07-15 07:07 for Informational use only, not trading advice. Terms and Risk Disclosure Copyright © 2026. Algo Trading Systems LLC.