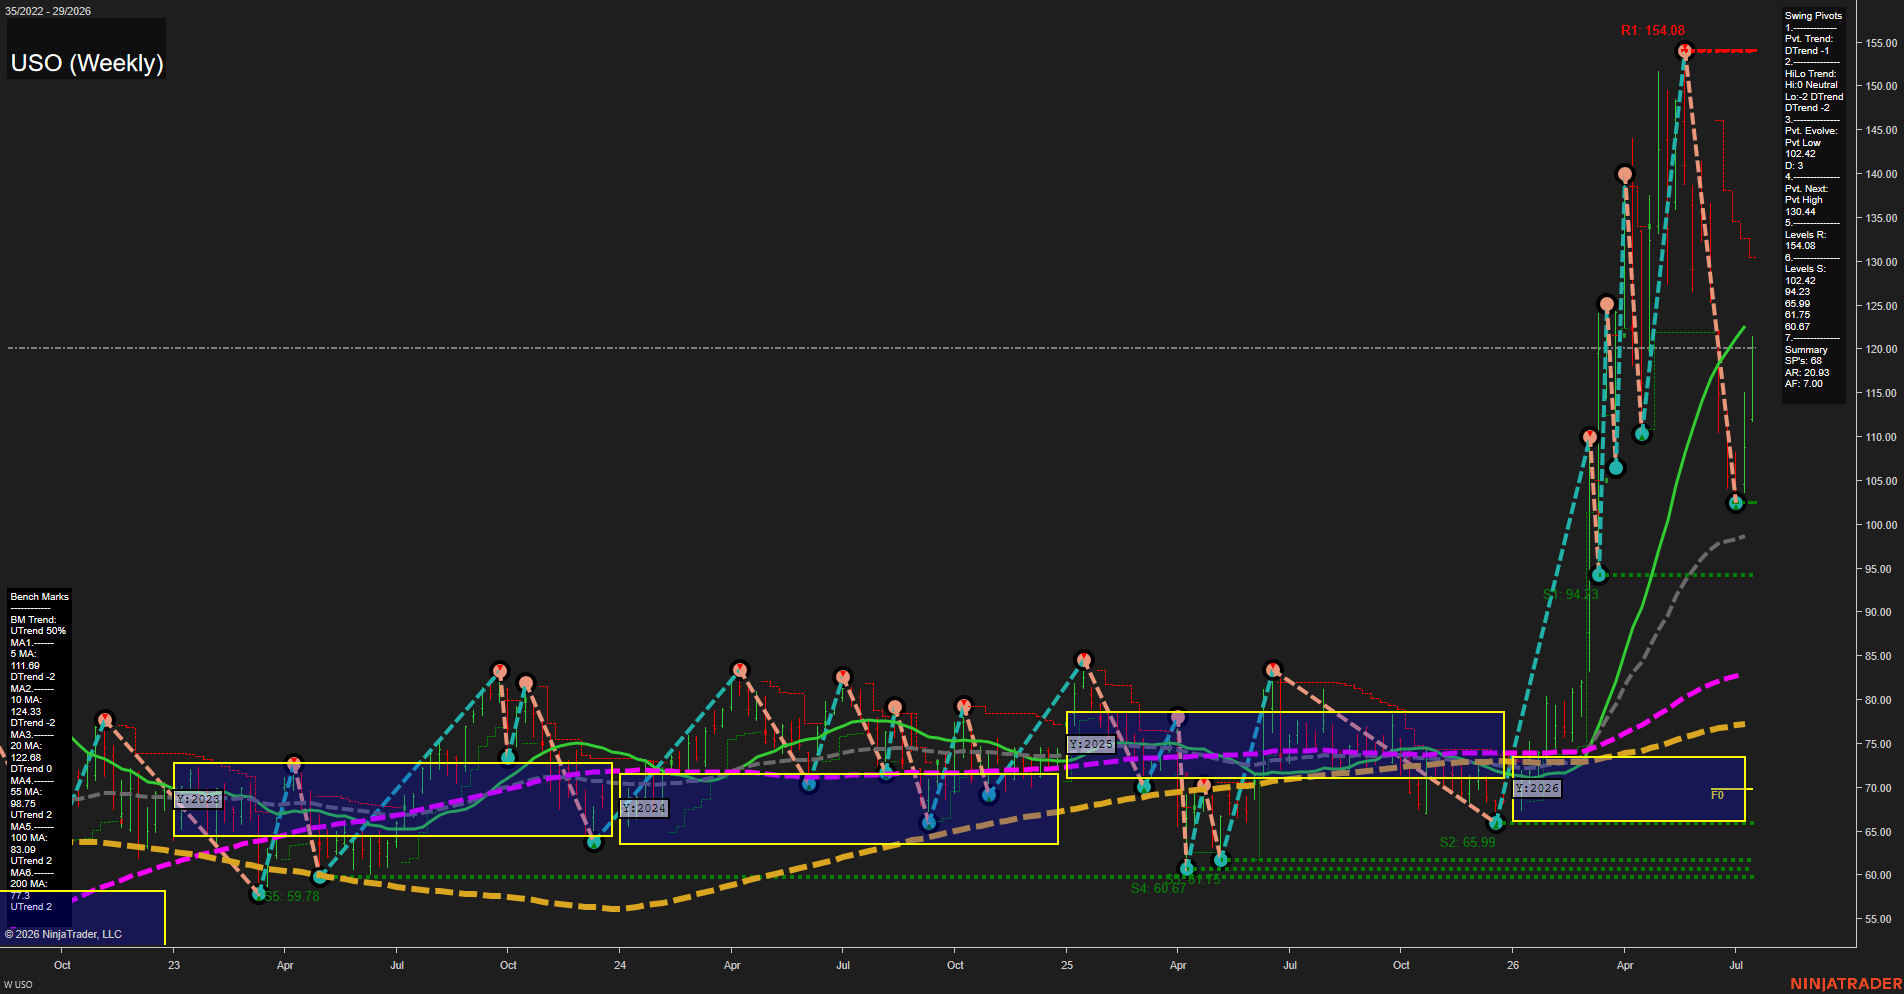
USO United States Oil Fund LP Weekly Chart Analysis: 2026-Jul-15 07:07 CT
Price Action
- Last: 102.90,
- Bars: Large,
- Mom: fast.
WSFG Weekly
- Short-Term
- WSFG Current: NA%
- F0%/NTZ' Bias: Price Neutral,
- WSFG Trend: Neutral.
MSFG Month Jul
- Intermediate-Term
- MSFG Current: NA%
- F0%/NTZ' Bias: Price Neutral,
- MSFG Trend: Neutral.
YSFG Year 2026
- Long-Term
- YSFG Current: NA%
- F0%/NTZ' Bias: Price Neutral,
- YSFG Trend: Neutral.
Swing Pivots
- (Short-Term) 1. Pvt. Trend: DTrend,
- (Intermediate-Term) 2. HiLo Trend: DTrend,
- 3. Pvt. Evolve: Pvt Low 102.42,
- 4. Pvt. Next: Pvt High 130.44,
- 5. Levels R: 154.08,
- 6. Levels S: 102.42, 94.23, 65.99, 61.75, 60.67.
Weekly Benchmarks
- (Short-Term) 5 Day: 111.69 Down Trend,
- (Short-Term) 10 Day: 124.33 Down Trend,
- (Intermediate-Term) 20 Day: 122.68 Down Trend,
- (Intermediate-Term) 55 Day: 98.75 Up Trend,
- (Long-Term) 100 Day: 83.09 Up Trend,
- (Long-Term) 200 Day: 77.30 Up Trend.
Overall Rating
- Short-Term: Bearish,
- Intermediate-Term: Bearish,
- Long-Term: Bullish.
Key Insights Summary
USO is coming off a very large upside expansion and is now in a fast downside swing from the recent peak near 154.08, with the current pivot structure shifted to a DTrend and the next pivot type marked as a higher swing high at 130.44. The short-term moving averages are all pointing down and price is trading below them, which matches the bearish near-term tape. Intermediate structure is mixed-to-bearish because the pivot trend and HiLo trend have rolled over, yet the 55-day benchmark remains in an uptrend and price is still above the 55-day area near 98.75. The long-term picture stays constructive as the 100-day and 200-day benchmarks remain in uptrends, showing that the broader cycle is still higher despite the recent weekly reversal from an extended rally. The chart reflects a sharp trend continuation move followed by a deep retracement from overbought conditions, with prior support levels clustered near 102.42, 94.23, and the 60s zone acting as the older swing structure beneath the current market. Overall, the weekly profile shows a strong countertrend pullback inside a longer-term bullish framework.
Chart Analysis ATS AI Generated: 2026-07-15 07:07 for Informational use only, not trading advice. Terms and Risk Disclosure Copyright © 2026. Algo Trading Systems LLC.