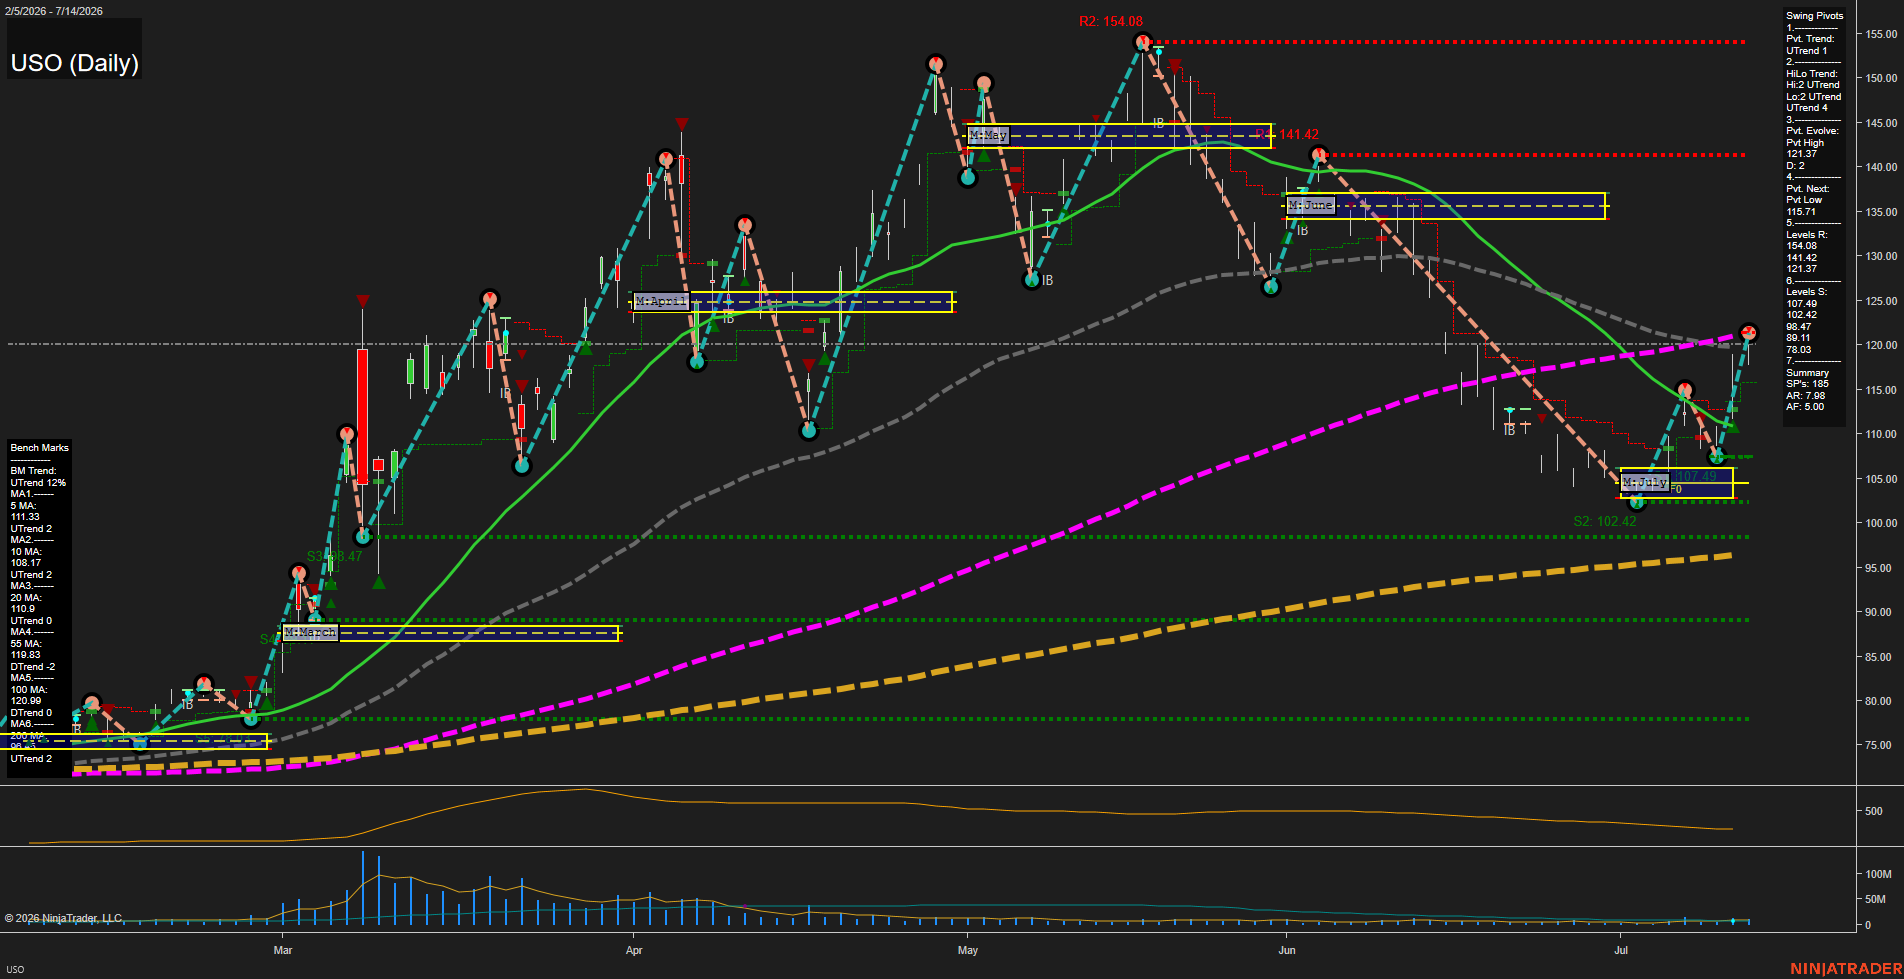
USO United States Oil Fund LP Daily Chart Analysis: 2026-Jul-15 07:07 CT
Price Action
- Last: 121.37,
- Bars: Large,
- Mom: Fast.
WSFG Weekly
- Short-Term
- WSFG Current: NA%
- F0%/NTZ' Bias: Price Neutral,
- WSFG Trend: Neutral.
MSFG Month Jul
- Intermediate-Term
- MSFG Current: NA%
- F0%/NTZ' Bias: Price Neutral,
- MSFG Trend: Neutral.
YSFG Year 2026
- Long-Term
- YSFG Current: NA%
- F0%/NTZ' Bias: Price Neutral,
- YSFG Trend: Neutral.
Swing Pivots
- (Short-Term) 1. Pvt. Trend: UTrend,
- (Intermediate-Term) 2. HiLo Trend: UTrend,
- 3. Pvt. Evolve: Pvt High 121.37,
- 4. Pvt. Next: Pvt Low 115.71,
- 5. Levels R: 154.08, 141.42, 121.37,
- 6. Levels S: 107.49, 102.42, 98.47, 89.11, 78.03.
Daily Benchmarks
- (Short-Term) 5 Day: 111.33 Up Trend,
- (Short-Term) 10 Day: 108.17 Up Trend,
- (Intermediate-Term) 20 Day: 110.90 Up Trend,
- (Intermediate-Term) 55 Day: 119.83 Down Trend,
- (Long-Term) 100 Day: 120.99 Down Trend,
- (Long-Term) 200 Day: 98.09 Up Trend.
Additional Metrics
- ATR: 138,
- VOLMA: 2577640.
Overall Rating
- Short-Term: Bullish,
- Intermediate-Term: Neutral,
- Long-Term: Bullish.
Key Insights Summary
USO is in a sharp rebound off the July pullback, with price reclaiming the 5, 10, and 20 day benchmarks while pressing back into the prior pivot zone near 121.37. The short-term swing structure remains UTrend and the pivot map shows the latest evolved point as a pivot high, with the next reference a pivot low at 115.71, reflecting an active bounce sequence after the recent selloff. Intermediate trend remains mixed because price is still below the 55 day and 100 day benchmarks, keeping the broader swing from fully resetting to a clean bullish trend. Long-term structure stays constructive above the rising 200 day, but the recent down leg from the June highs to the early July base keeps the chart in a transition phase marked by strong volatility, wide bars, and a fast momentum rebound.
Chart Analysis ATS AI Generated: 2026-07-15 07:07 for Informational use only, not trading advice. Terms and Risk Disclosure Copyright © 2026. Algo Trading Systems LLC.