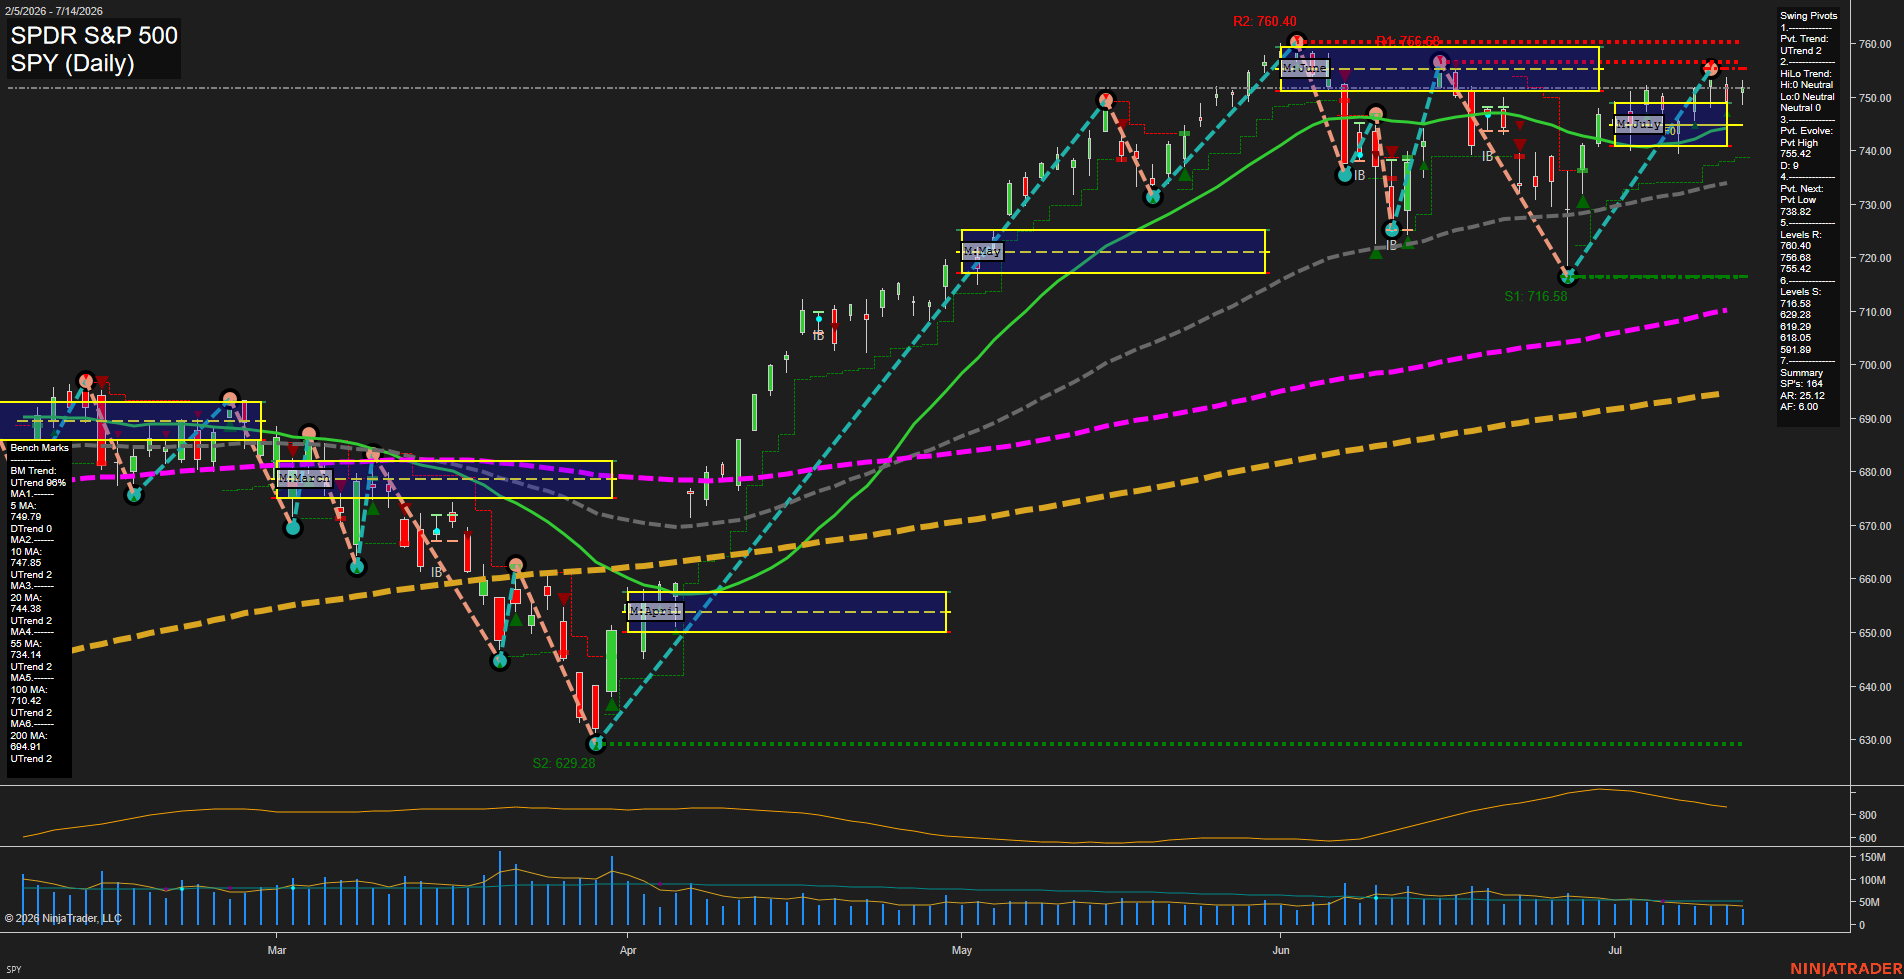
SPY SPDR S&P 500 Daily Chart Analysis: 2026-Jul-15 07:06 CT
Price Action
- Last: 756.00,
- Bars: Medium,
- Mom: average.
WSFG Weekly
- Short-Term
- WSFG Current: NA%
- F0%/NTZ' Bias: Price Neutral,
- WSFG Trend: Neutral.
MSFG Month Jul
- Intermediate-Term
- MSFG Current: NA%
- F0%/NTZ' Bias: Price Neutral,
- MSFG Trend: Neutral.
YSFG Year 2026
- Long-Term
- YSFG Current: NA%
- F0%/NTZ' Bias: Price Neutral,
- YSFG Trend: Neutral.
Swing Pivots
- (Short-Term) 1. Pvt. Trend: UTrend,
- (Intermediate-Term) 2. HiLo Trend: UTrend,
- 3. Pvt. Evolve: Pvt High 755.42,
- 4. Pvt. Next: Pvt Low 738.82,
- 5. Levels R: 760.40, 756.68, 755.42,
- 6. Levels S: 716.58, 629.28, 619.29, 618.29, 618.05, 591.89.
Daily Benchmarks
- (Short-Term) 5 Day: 749.79 Down Trend,
- (Short-Term) 10 Day: 747.85 Up Trend,
- (Intermediate-Term) 20 Day: 744.38 Up Trend,
- (Intermediate-Term) 55 Day: 734.14 Up Trend,
- (Long-Term) 100 Day: 710.42 Up Trend,
- (Long-Term) 200 Day: 694.91 Up Trend.
Additional Metrics
- ATR: 564,
- VOLMA: 47470907.
Overall Rating
- Short-Term: Bullish,
- Intermediate-Term: Bullish,
- Long-Term: Bullish.
Key Insights Summary
SPY remains in a constructive higher-high, higher-low sequence after the spring low and the strong June breakout, with price holding above the 20, 55, 100, and 200 day benchmarks. The short-term profile is still active and upward biased, but the latest push is occurring under nearby resistance in the 756.68 to 760.40 zone, which matches the prior swing high area and the top of the current monthly structure. The 5 day benchmark is below price and still lagging, while the 10 day and all higher benchmarks are stacked in support of the broader trend. Swing pivot structure shows an evolving bullish tape with the next downside pivot mapped lower, reflecting a market that has already advanced sharply and is now cycling through a consolidation-to-breakout continuation phase. The larger picture remains bullish across short, intermediate, and long-term frames, with the main technical theme centered on trend persistence, retest behavior, and price discovery near overhead resistance.
Chart Analysis ATS AI Generated: 2026-07-15 07:07 for Informational use only, not trading advice. Terms and Risk Disclosure Copyright © 2026. Algo Trading Systems LLC.