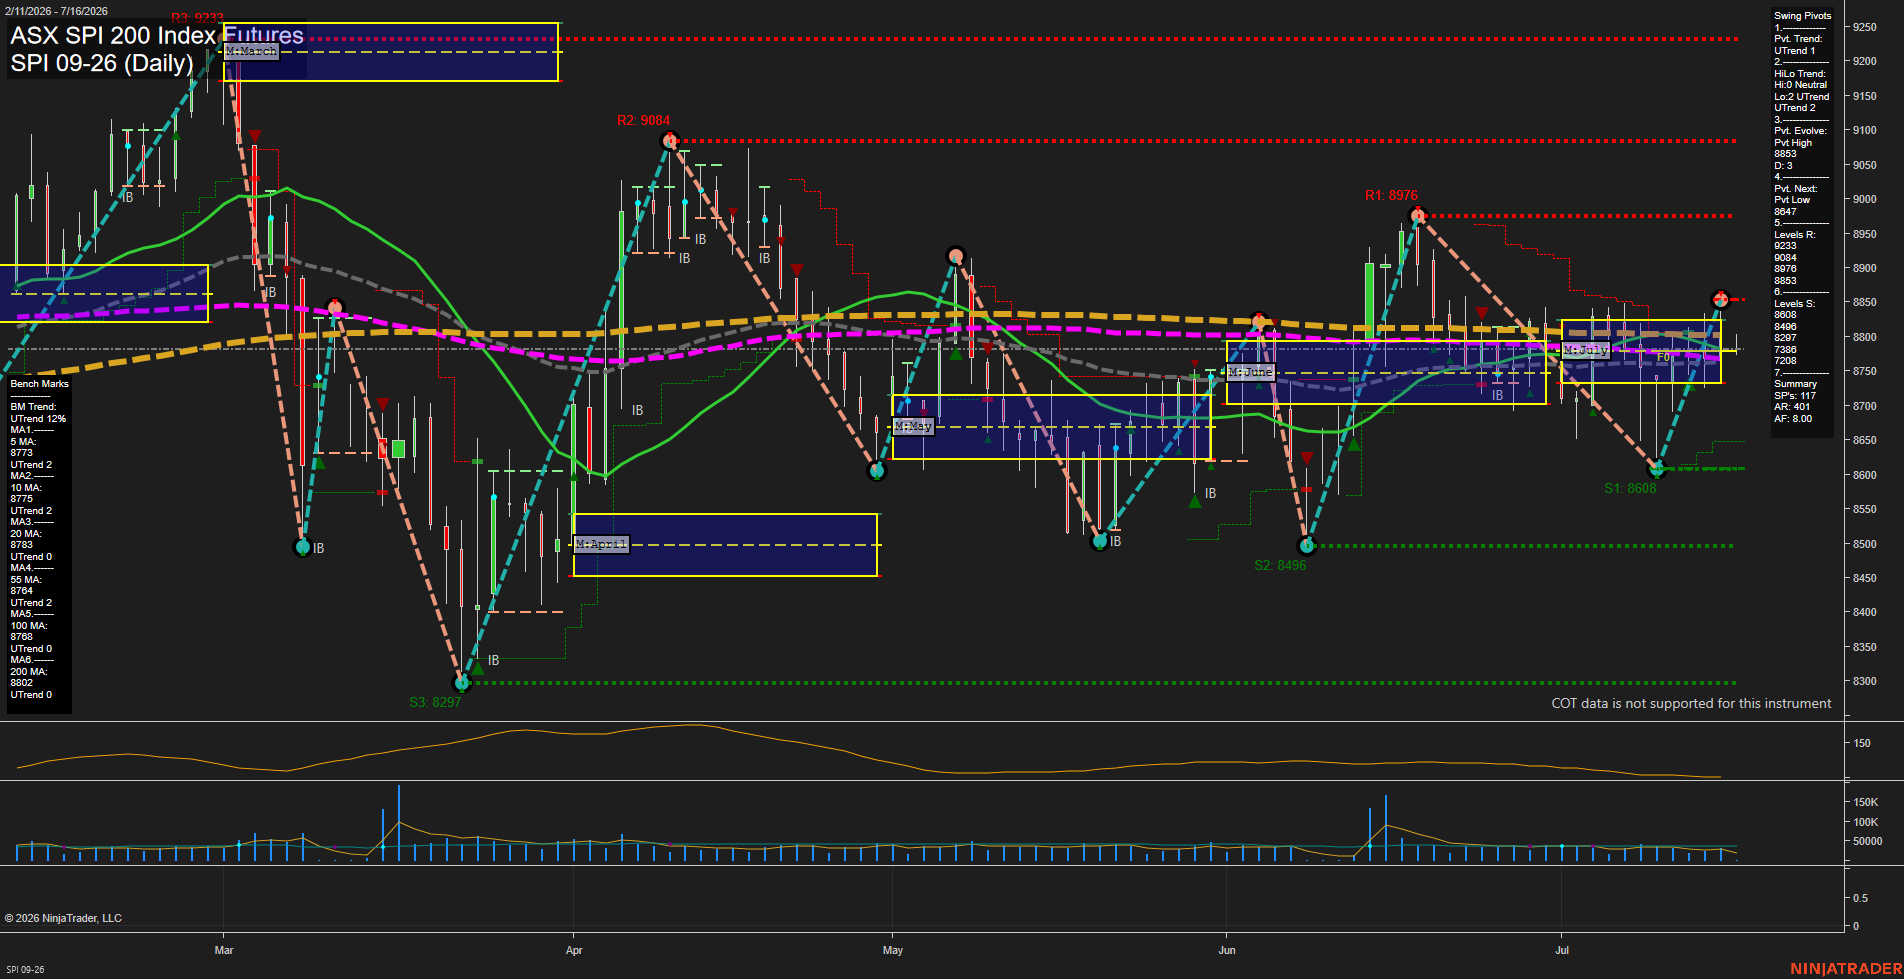
SPI ASX SPI 200 Index Futures Daily Chart Analysis: 2026-Jul-15 07:06 CT
Price Action
- Last: 8780,
- Bars: Medium,
- Mom: Slow.
WSFG Weekly
- Short-Term
- WSFG Current: NA%
- F0%/NTZ' Bias: Price Neutral,
- WSFG Trend: Neutral.
MSFG Month Jul
- Intermediate-Term
- MSFG Current: NA%
- F0%/NTZ' Bias: Price Neutral,
- MSFG Trend: Neutral.
YSFG Year 2026
- Long-Term
- YSFG Current: NA%
- F0%/NTZ' Bias: Price Neutral,
- YSFG Trend: Neutral.
Swing Pivots
- (Short-Term) 1. Pvt. Trend: UTrend,
- (Intermediate-Term) 2. HiLo Trend: UTrend,
- 3. Pvt. Evolve: Pvt High 8853,
- 4. Pvt. Next: Pvt Low 8647,
- 5. Levels R: 9233, 9084, 8976, 8853,
- 6. Levels S: 8608, 8496, 8297, 7386, 7208.
Daily Benchmarks
- (Short-Term) 5 Day: 8773 Up Trend,
- (Short-Term) 10 Day: 8775 Up Trend,
- (Intermediate-Term) 20 Day: 8783 Up Trend,
- (Intermediate-Term) 55 Day: 8764 Up Trend,
- (Long-Term) 100 Day: 8768 Up Trend,
- (Long-Term) 200 Day: 8802 Up Trend.
Additional Metrics
Overall Rating
- Short-Term: Neutral,
- Intermediate-Term: Neutral,
- Long-Term: Neutral.
Key Insights Summary
The daily structure is balanced and rotational, with price sitting inside a broad consolidation band and near a tight cluster of benchmark moving averages around the high-8700s. Swing pivot structure still shows an uptrend bias in the short term, but the market remains capped by nearby resistance levels in the upper-8800s to upper-8900s while support is layered in the mid-8600s and lower-8500s. The latest sequence reflects a range-trading environment with overlapping candles, inside-bar behavior, and repeated tests of the MSFG zone, which keeps the tape more sideways than directional. Longer swings remain defined by the larger pivot levels at 8976, 9084, and 9233 on the upside versus 8608, 8496, and 8297 on the downside.
Chart Analysis ATS AI Generated: 2026-07-15 07:06 for Informational use only, not trading advice. Terms and Risk Disclosure Copyright © 2026. Algo Trading Systems LLC.