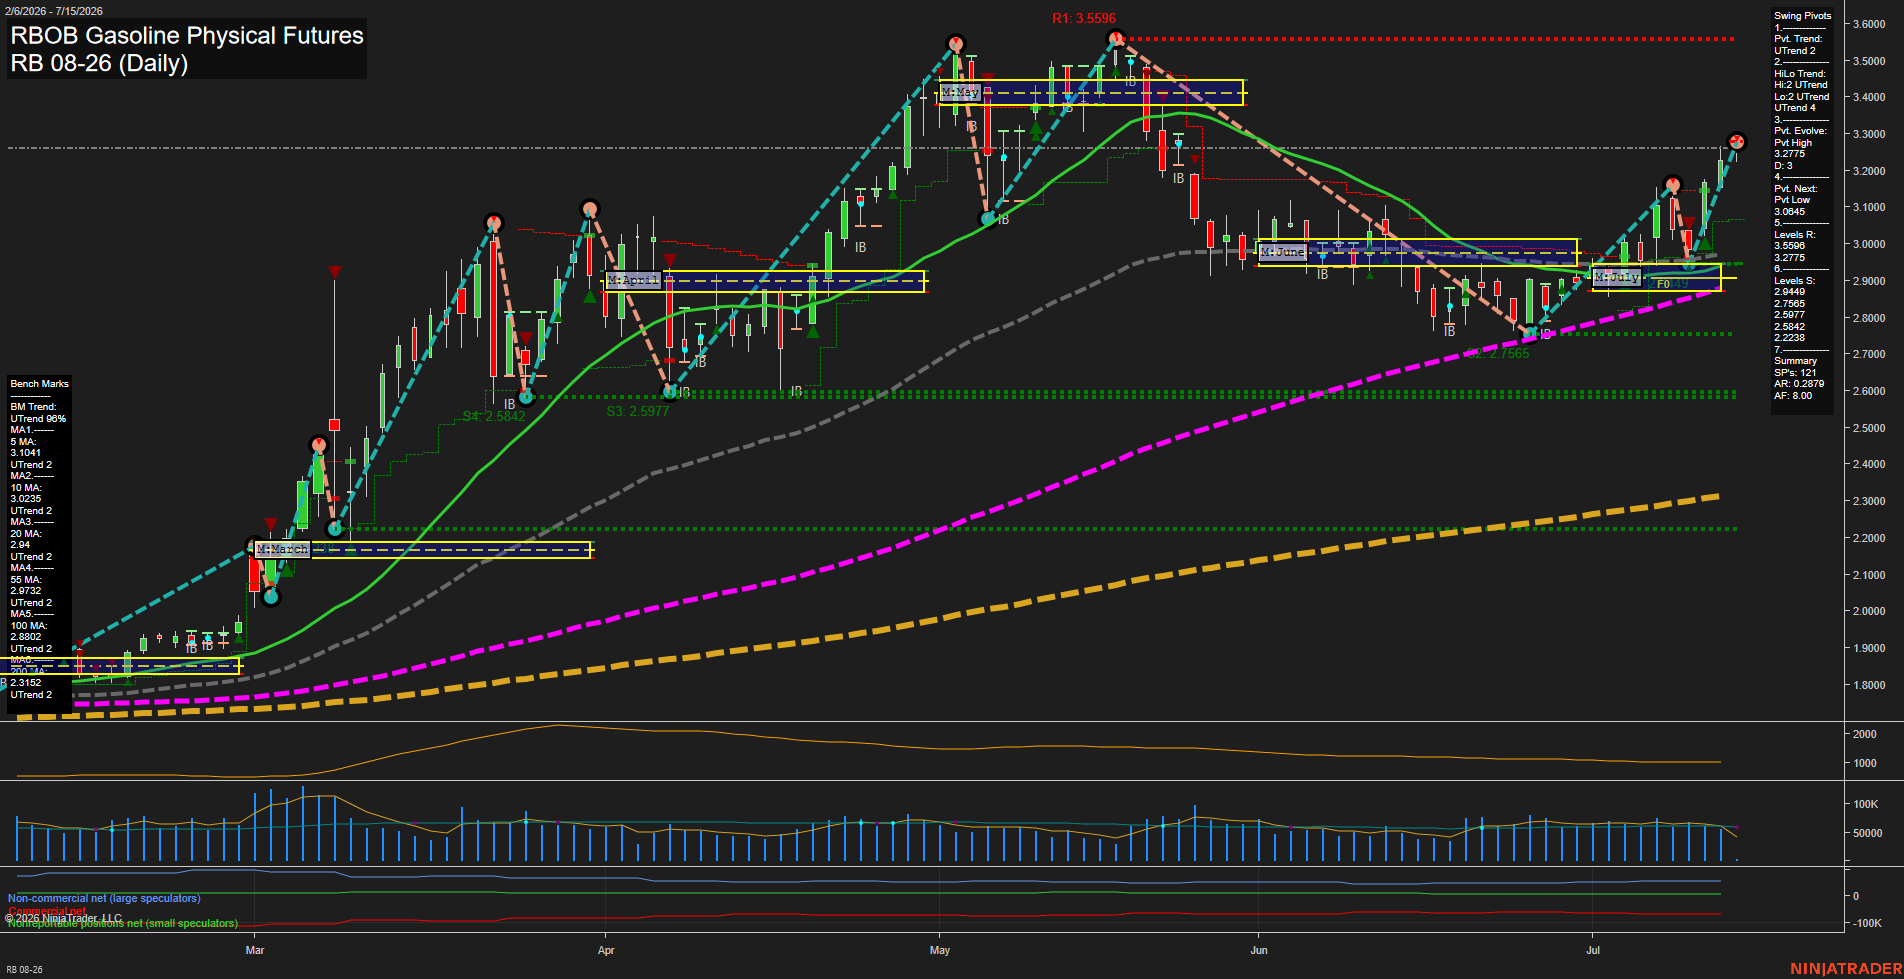
RB RBOB Gasoline Physical Futures Daily Chart Analysis: 2026-Jul-15 07:05 CT
Price Action
- Last: 3.2775,
- Bars: Medium,
- Mom: Fast.
WSFG Weekly
- Short-Term
- WSFG Current: 123%
- F0%/NTZ' Bias: Price Above,
- WSFG Trend: Up.
MSFG Month Jul
- Intermediate-Term
- MSFG Current: 56%
- F0%/NTZ' Bias: Price Above,
- MSFG Trend: Up.
YSFG Year 2026
- Long-Term
- YSFG Current: 160%
- F0%/NTZ' Bias: Price Above,
- YSFG Trend: Up.
Swing Pivots
- (Short-Term) 1. Pvt. Trend: UTrend,
- (Intermediate-Term) 2. HiLo Trend: UTrend,
- 3. Pvt. Evolve: Pvt High 3.2775,
- 4. Pvt. Next: Pvt Low 3.0845,
- 5. Levels R: 3.5596, 3.2775,
- 6. Levels S: 2.9449, 2.7565, 2.5977, 2.5842, 2.2238.
Daily Benchmarks
- (Short-Term) 5 Day: 3.1041 Up Trend,
- (Short-Term) 10 Day: 3.0235 Up Trend,
- (Intermediate-Term) 20 Day: 2.9400 Up Trend,
- (Intermediate-Term) 55 Day: 2.9732 Up Trend,
- (Long-Term) 100 Day: 2.8802 Up Trend,
- (Long-Term) 200 Day: 2.3152 Up Trend.
Additional Metrics
Recent Trade Signals
- 13 Jul 2026: Long RB 08-26 @ 3.0581 Signals.USAR-WSFG
- 13 Jul 2026: Long RB 08-26 @ 3.0581 Signals.USAR-MSFG
- 09 Jul 2026: Short RB 08-26 @ 3.0249 Signals.USAR.TR120
- 08 Jul 2026: Long RB 08-26 @ 3.1457 Signals.USAR.TR720
Overall Rating
- Short-Term: Bullish,
- Intermediate-Term: Bullish,
- Long-Term: Bullish.
Key Insights Summary
Price is holding above the key short-, intermediate-, and long-term benchmark averages, with the latest pivot structure still in an uptrend and the current pivot evolved into a pivot high at 3.2775. The market has recovered sharply from the late-June/early-July pullback, reclaiming the upper part of the monthly session grid and pressing into the July NTZ area with price above the F0% center bias. The swing map shows clear upside continuation from the June low structure, while the next pivot reference remains a lower pivot at 3.0845 and resistance is marked above at 3.5596. The chart reflects a strong trend phase with constructive higher highs and higher lows, supported by aligned moving averages and bullish weekly, monthly, and yearly session grid positioning.
Chart Analysis ATS AI Generated: 2026-07-15 07:05 for Informational use only, not trading advice. Terms and Risk Disclosure Copyright © 2026. Algo Trading Systems LLC.