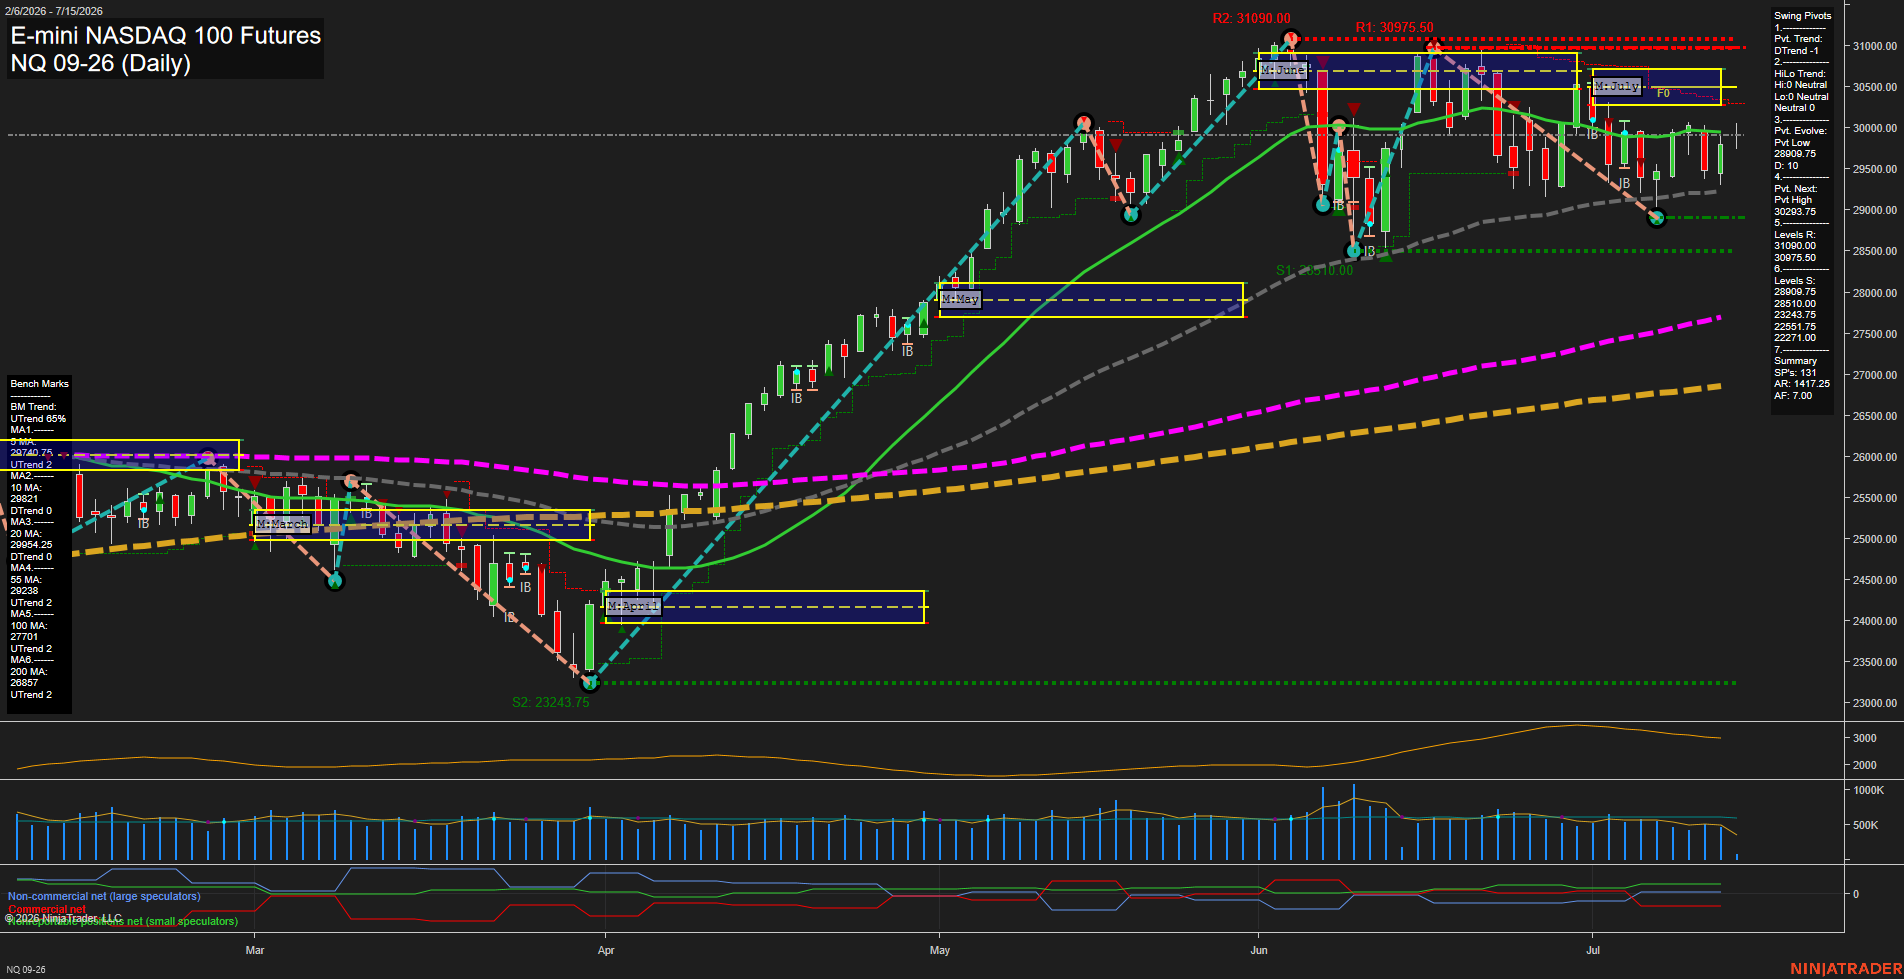
NQ E-mini NASDAQ 100 Futures Daily Chart Analysis: 2026-Jul-15 07:04 CT
Price Action
- Last: 29960,
- Bars: Medium,
- Mom: average.
WSFG Weekly
- Short-Term
- WSFG Current: -3%
- F0%/NTZ' Bias: Price Below,
- WSFG Trend: Down.
MSFG Month Jul
- Intermediate-Term
- MSFG Current: -19%
- F0%/NTZ' Bias: Price Below,
- MSFG Trend: Down.
YSFG Year 2026
- Long-Term
- YSFG Current: 81%
- F0%/NTZ' Bias: Price Above,
- YSFG Trend: Up.
Swing Pivots
- (Short-Term) 1. Pvt. Trend: DTrend,
- (Intermediate-Term) 2. HiLo Trend: DTrend,
- 3. Pvt. Evolve: Pvt Low 28909.75,
- 4. Pvt. Next: Pvt High 30293.75,
- 5. Levels R: 31090.00, 30975.50,
- 6. Levels S: 28909.75, 28510.00, 23243.75, 22551.75, 22271.00.
Daily Benchmarks
- (Short-Term) 5 Day: 29740.75 Up Trend,
- (Short-Term) 10 Day: 29821.00 Down Trend,
- (Intermediate-Term) 20 Day: 29954.25 Down Trend,
- (Intermediate-Term) 55 Day: 29238.00 Up Trend,
- (Long-Term) 100 Day: 27701.00 Up Trend,
- (Long-Term) 200 Day: 26857.00 Up Trend.
Additional Metrics
- ATR: 1618,
- VOLMA: 626746.
Recent Trade Signals
- 14 Jul 2026: Long NQ 09-26 @ 29863 Signals.USAR.TR120
- 13 Jul 2026: Short NQ 09-26 @ 29755.75 Signals.USAR-WSFG
Overall Rating
- Short-Term: Bearish,
- Intermediate-Term: Bearish,
- Long-Term: Bullish.
Key Insights Summary
Price is trading below both the weekly and monthly session fib zero lines, which keeps the short- and intermediate-term structure tilted lower despite the longer-term 2026 yearly profile remaining firmly above its midpoint. The swing pivot model is in a down phase with a lower pivot evolve and the next opposite pivot defined higher at 30293.75, while nearby resistance remains stacked overhead at 30975.50 and 31090.00. Benchmark alignment is mixed but still corrective in the nearer time frames, with the 5-day above price support behavior and the 10-day and 20-day leaning lower, while the 55-day, 100-day, and 200-day remain constructive on the broader trend. The recent sequence shows a strong advance into June, followed by a pullback and consolidation band into July, leaving the chart in a choppy, range-to-corrective posture under the upper resistance shelf.
Chart Analysis ATS AI Generated: 2026-07-15 07:05 for Informational use only, not trading advice. Terms and Risk Disclosure Copyright © 2026. Algo Trading Systems LLC.