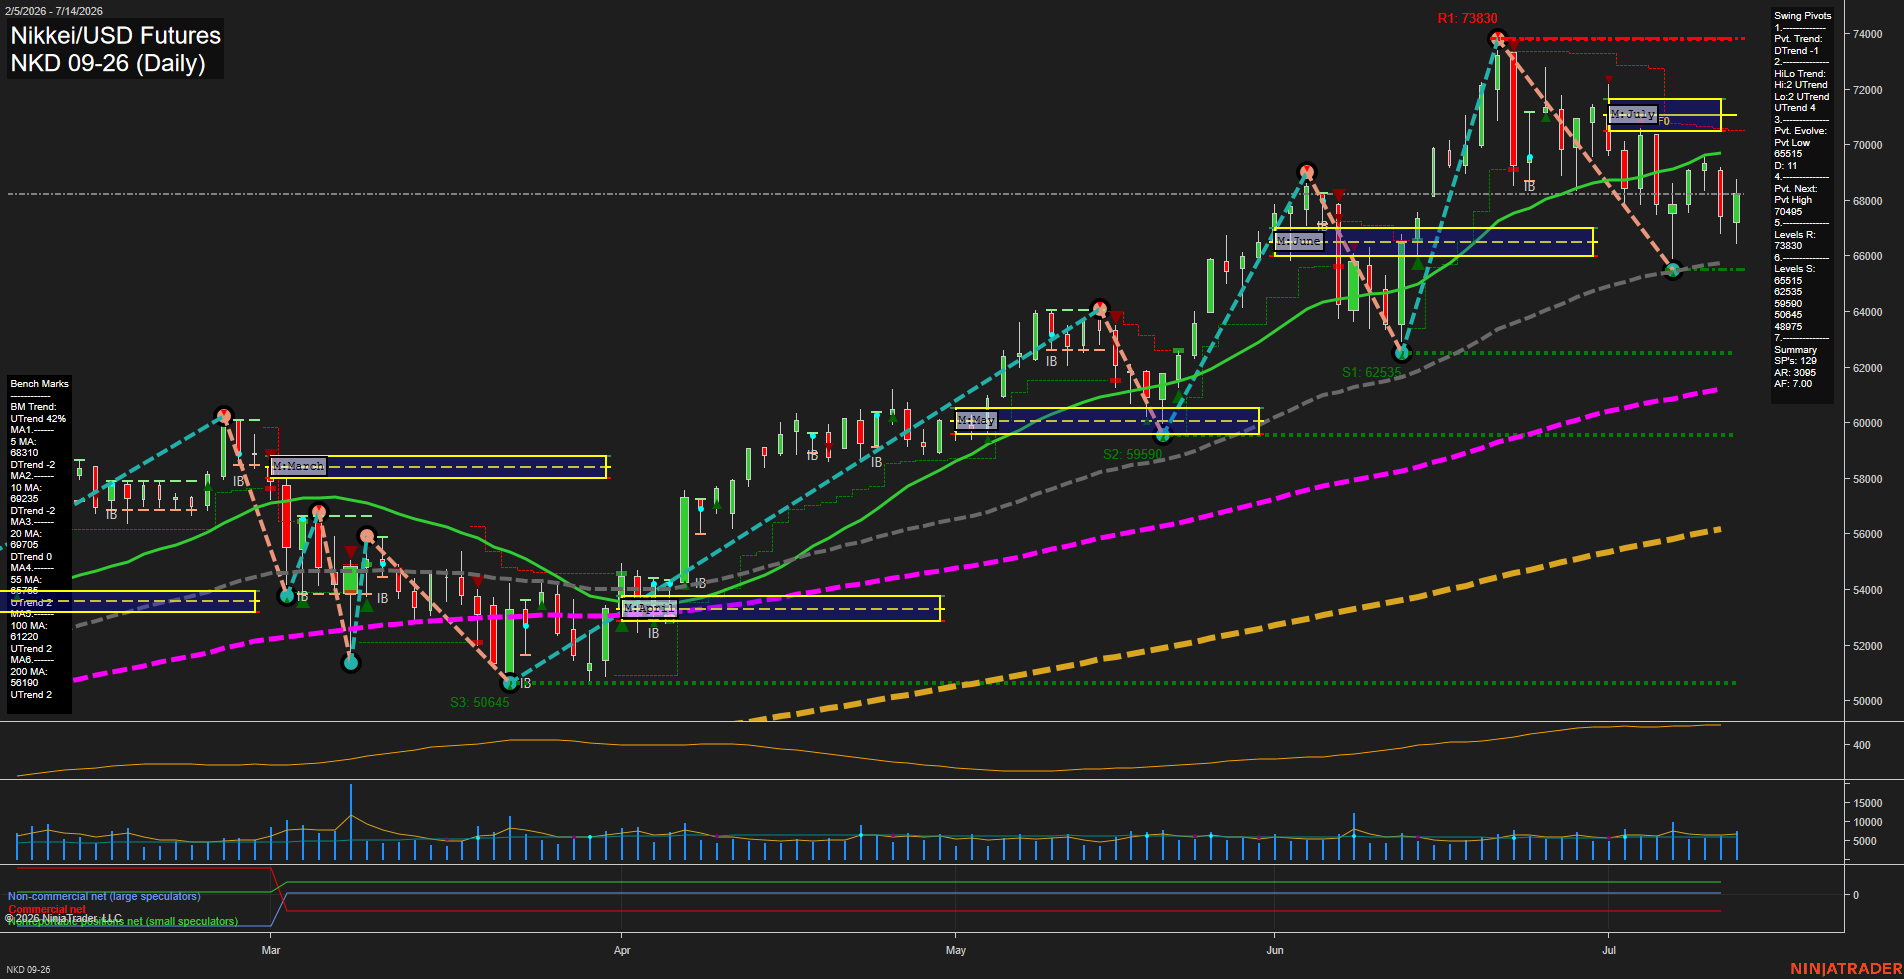
NKD Nikkei/USD Futures Daily Chart Analysis: 2026-Jul-15 07:04 CT
Price Action
- Last: 67625,
- Bars: Medium,
- Mom: average.
WSFG Weekly
- Short-Term
- WSFG Current: -15%
- F0%/NTZ' Bias: Price Below,
- WSFG Trend: Down.
MSFG Month Jul
- Intermediate-Term
- MSFG Current: -30%
- F0%/NTZ' Bias: Price Below,
- MSFG Trend: Down.
YSFG Year 2026
- Long-Term
- YSFG Current: 208%
- F0%/NTZ' Bias: Price Above,
- YSFG Trend: Up.
Swing Pivots
- (Short-Term) 1. Pvt. Trend: DTrend,
- (Intermediate-Term) 2. HiLo Trend: UTrend,
- 3. Pvt. Evolve: Pvt Low 65515,
- 4. Pvt. Next: Pvt High 70495,
- 5. Levels R: 73830,
- 6. Levels S: 65515, 62535, 59590, 50645, 48975.
Daily Benchmarks
- (Short-Term) 5 Day: 68310 Down Trend,
- (Short-Term) 10 Day: 66923 Down Trend,
- (Intermediate-Term) 20 Day: 69705 Down Trend,
- (Intermediate-Term) 55 Day: 65775 Up Trend,
- (Long-Term) 100 Day: 61220 Up Trend,
- (Long-Term) 200 Day: 56190 Up Trend.
Additional Metrics
Recent Trade Signals
- 15 Jul 2026: Long NKD 09-26 @ 68785 Signals.USAR.TR120
- 13 Jul 2026: Short NKD 09-26 @ 68150 Signals.USAR-WSFG
Overall Rating
- Short-Term: Bearish,
- Intermediate-Term: Bearish,
- Long-Term: Bullish.
Key Insights Summary
The daily structure shows a corrective pullback after a strong June rally and early-July peak near 73830, with price now trading back below the monthly and weekly fib equilibrium zones. Short-term pivot structure remains in a DTrend while the Hi/Lo framework is still UTrend, which reflects a mixed but weakening swing profile after the recent rejection from the upper range. Price is sitting under the 5, 10, and 20 day benchmarks, while still holding above the 55, 100, and 200 day averages, keeping the broader trend constructive even as near-term momentum softens. The setup looks like a post-breakout consolidation with lower highs from the recent peak and support layers stacked at 65515, 62535, and 59590, while 70495 remains the next pivot high reference. Overall, the chart reads as bearish on the swing horizon, but still bullish across the larger yearly trend and major moving-average structure.
Chart Analysis ATS AI Generated: 2026-07-15 07:04 for Informational use only, not trading advice. Terms and Risk Disclosure Copyright © 2026. Algo Trading Systems LLC.