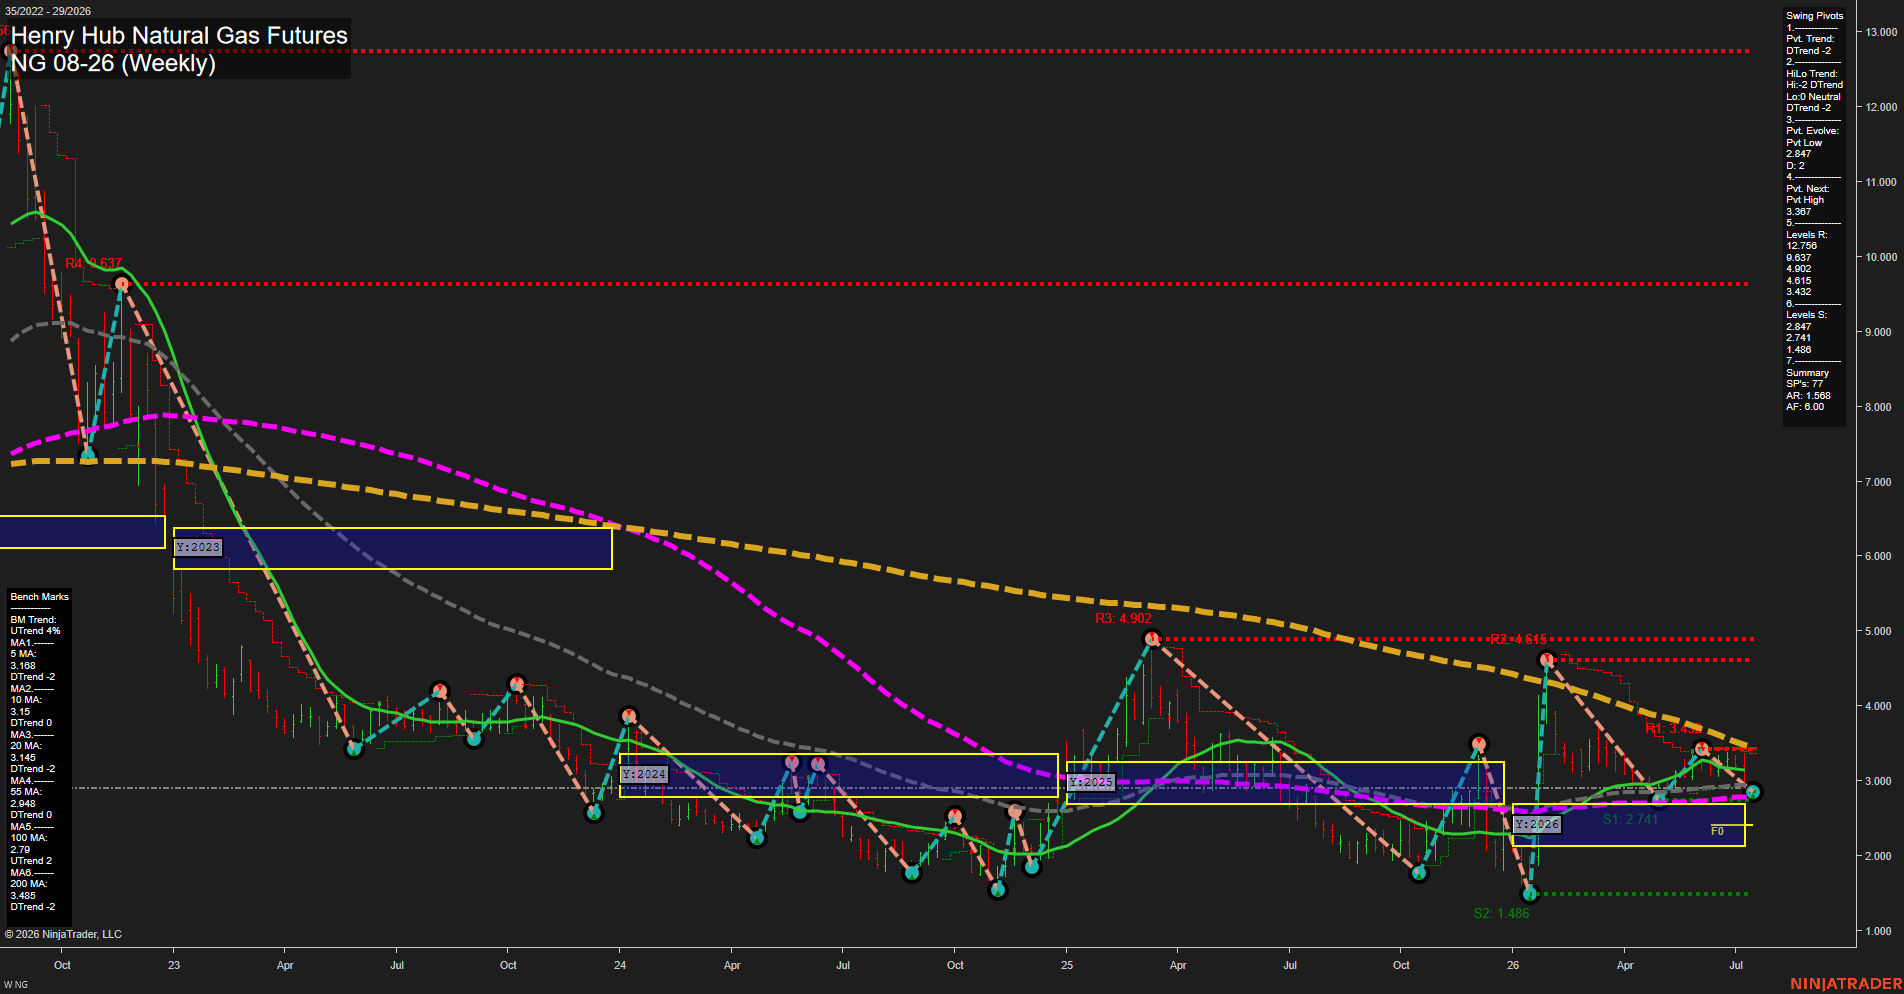
NG Henry Hub Natural Gas Futures Weekly Chart Analysis: 2026-Jul-15 07:04 CT
Price Action
- Last: 2.847,
- Bars: Medium,
- Mom: slow.
WSFG Weekly
- Short-Term
- WSFG Current: -8%
- F0%/NTZ' Bias: Price Below,
- WSFG Trend: Down.
MSFG Month Jul
- Intermediate-Term
- MSFG Current: -74%
- F0%/NTZ' Bias: Price Below,
- MSFG Trend: Down.
YSFG Year 2026
- Long-Term
- YSFG Current: 18%
- F0%/NTZ' Bias: Price Above,
- YSFG Trend: Up.
Swing Pivots
- (Short-Term) 1. Pvt. Trend: DTrend,
- (Intermediate-Term) 2. HiLo Trend: DTrend,
- 3. Pvt. Evolve: Pvt Low 2.847,
- 4. Pvt. Next: Pvt High 3.387,
- 5. Levels R: 12.758, 9.637, 4.902, 4.615, 3.432,
- 6. Levels S: 2.847, 2.741, 1.486.
Weekly Benchmarks
- (Short-Term) 5 Day: 3.168 Down Trend,
- (Short-Term) 10 Day: 3.15 Down Trend,
- (Intermediate-Term) 20 Day: 3.145 Down Trend,
- (Intermediate-Term) 55 Day: 2.948 Neutral Trend,
- (Long-Term) 100 Day: 2.79 Up Trend,
- (Long-Term) 200 Day: 3.485 Down Trend.
Recent Trade Signals
- 14 Jul 2026: Short NG 08-26 @ 2.867 Signals.USAR-WSFG
- 09 Jul 2026: Short NG 08-26 @ 3.03 Signals.USAR.TR720
- 09 Jul 2026: Short NG 08-26 @ 3.203 Signals.USAR-MSFG
- 07 Jul 2026: Long NG 08-26 @ 3.272 Signals.USAR.TR120
Overall Rating
- Short-Term: Bearish,
- Intermediate-Term: Bearish,
- Long-Term: Neutral.
Key Insights Summary
Weekly NG remains in a broad downtrend structure with a slow downside momentum profile and price holding below the weekly, monthly, and most short/intermediate benchmarks. The swing pivot model is still pointed down, with the latest pivot evolving from a low at 2.847 and the next opposing pivot projected higher at 3.387, which defines the nearby reversal framework. Recent signals favor the bearish side across weekly and monthly session grids, while the yearly grid is still positive and above its NTZ, showing that the larger 2026 cycle has not fully broken down. Benchmark alignment is mixed but still leans soft, with the 5, 10, 20, and 200 day measures below price structure pressure, while the 100 day reads stronger than the rest. Overall, the chart is best described as a bearish weekly swing environment inside a larger, less resolved long-term cycle, with rallies struggling against layered overhead resistance and the broader pattern still dominated by lower highs and lower lows.
Chart Analysis ATS AI Generated: 2026-07-15 07:04 for Informational use only, not trading advice. Terms and Risk Disclosure Copyright © 2026. Algo Trading Systems LLC.